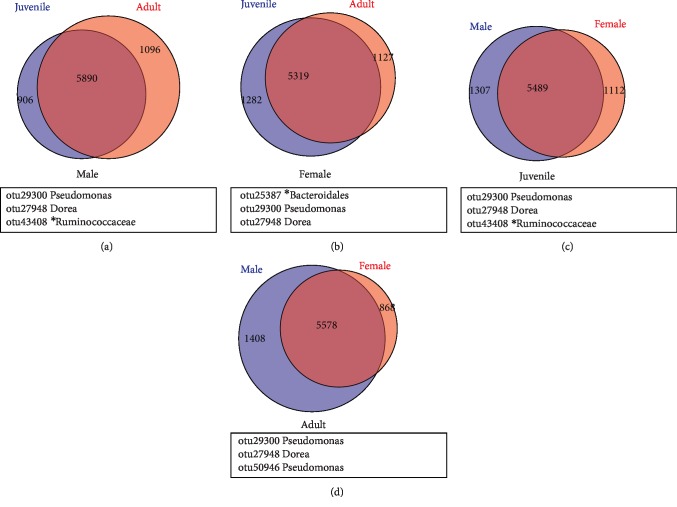
Figure 3.
Distribution of bacterial taxa within the four sample groups in Venn diagrams. The numbers in the Venn diagrams represent the unique or common OTUs between the individuals of (a) JMF –AMF (Male), (b) JFF–AFF (Female), (c) JMF–JFF (Juvenile), and (d) AMF–AFF (Adult). The black box below the Venn diagram represents the shared core microbiome.

