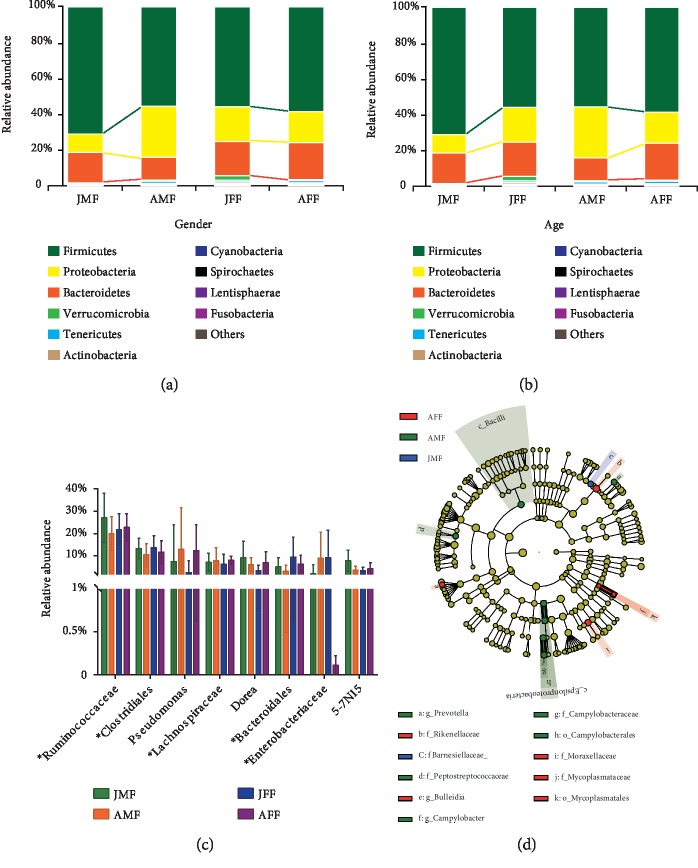
Figure 4.
A general overview of microbial composition of different sample groups. (a, b) Phylum level, microbial composition of different groups. (c) Differences in relative abundance of top eight genera (contain the unclassified bacteria indicated with “∗”) among four sampling groups. The significances were determined using the independent-sample t-test. (d) Cladogram showing the differences in relative abundance of taxa at five levels between AFF, AMF and JMF. The plot was generated using the online LEfSe software. Red and green circles representing differences in relative abundance between AFF, AMF and JMF and yellow circles mean nonsignificant differences.

