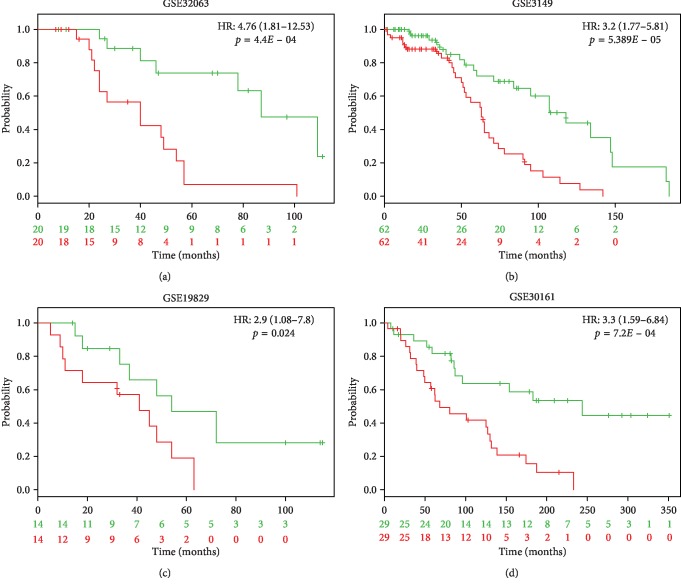
Figure 5.
Validation of the 11-gene signature using four independent ovarian cancer cohorts. We analyzed the Kaplan–Meier plots generated for the four cohorts used by applying the 11-gene signature. The patient cohort was split by the median based on the prognostic index, and the log-rank p-values of the curve comparison between the risk groups and HR are shown. The HR values and 95% confidence intervals were calculated using Cox survival analysis.

