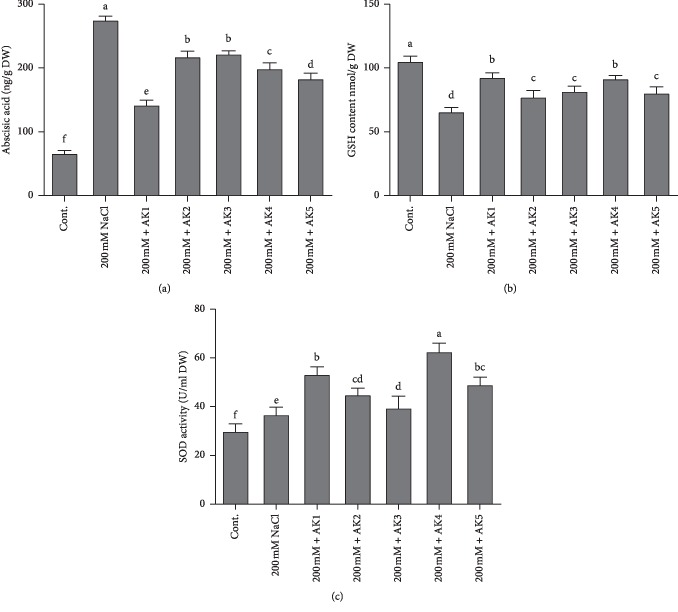
Figure 3.
Endogenous abscisic acid (ABA), reduced glutathione (GSH), and superoxide dismutase (SOD) activity quantification in rhizospheric bacteria inoculated on soybean plants. (a) shows ABA, (b) shows the amount of GSH, and (c) shows SOD activity under normal and stressful conditions. Each data point is the mean of at least three replicates. Error bars represent standard errors. The bars represented with different letters are significantly different from each other as evaluated by DMRT.

