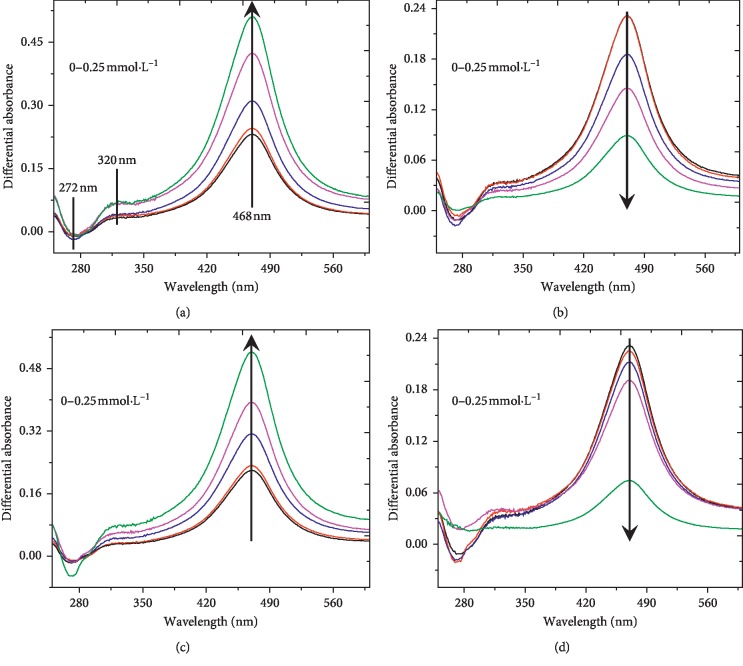
Figure 9.
UV-Vis differential absorbance spectra (DAS) calculated on the basis of the data recorded at different metal ion concentrations (0, 0.002, 0.01, 0.05, and 0.25 mmol·L−1). Reaction conditions: Nano-MnO2 = 0.1 mg·mL−1; 2,6-DMP = 1.0 mmol·L−1; metal ion = 0–0.25 mmol·L−1. Error bars represent the standard deviation (n = 3). (a) Cu2+, (b) Zn2+, (c) Mn2+, and (d) Fe2+.

