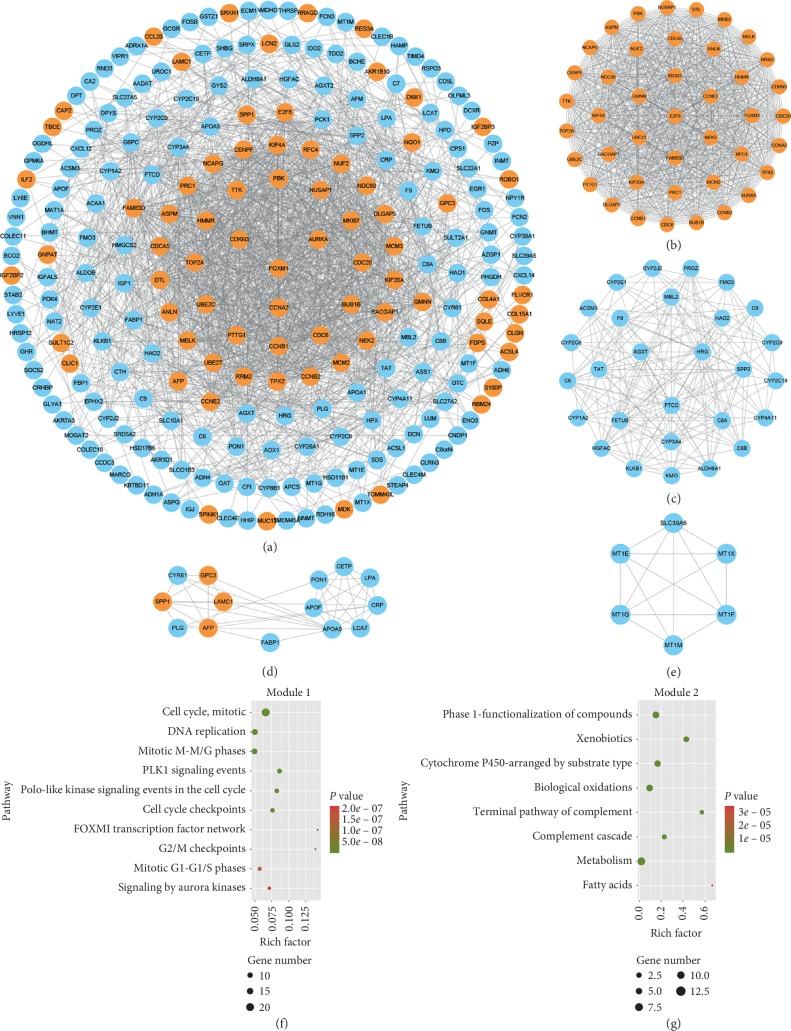
Figure 5.
PPI network diagrams of DEGs and module network and pathway enrichment analysis of modules. (a) PPI network of DEGs. Red nodes represent upregulated genes and blue nodes represent downregulated genes. (b) Module 1, MCODE score = 40.78; (c) module 2, MCODE score = 11.778; (d) module 3, MCODE score = 6.615; (e) module 4, MCODE score = 5.6. Pathway analysis of (f) module 1 and (g) module 2.

