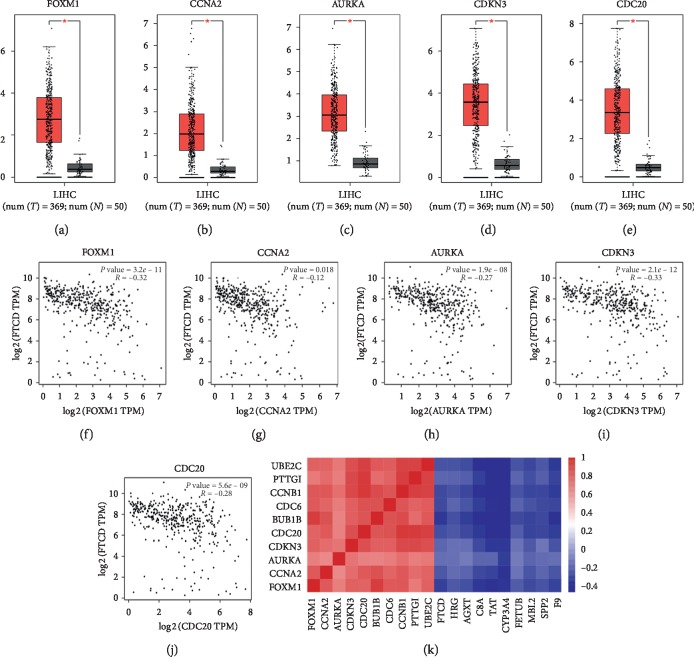
Figure 6.
Top five hub genes expression level in liver hepatocellular carcinoma (LIHC) and correlation analysis among hub genes. (a–e) Boxplots of expression level of FOXM1, CCNA2, AURKA, CDKN3, and CDC20. (f–j) Scatter plots of correlation analysis of FTCD and the top five hub genes. (k) Heatmap of correlation coefficients among the top ten hub genes in module 1 and module 2.

