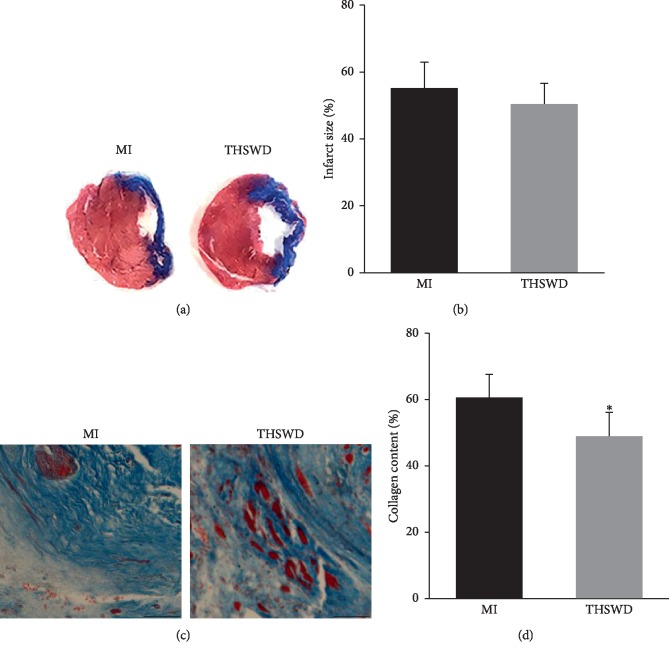
Figure 2.
Effect of THSWD on infarct size and collagen deposition in the infarcted area. (a, b) Masson's trichrome staining was performed to detect the infarction size and collagen content in each group. Scale bar = 50 μm. (c) Quantitative analysis of myocardial infarct area. (d) Quantitative analysis of collagen content in the infarcted area. ∗P < 0.05 versus the MI group.

