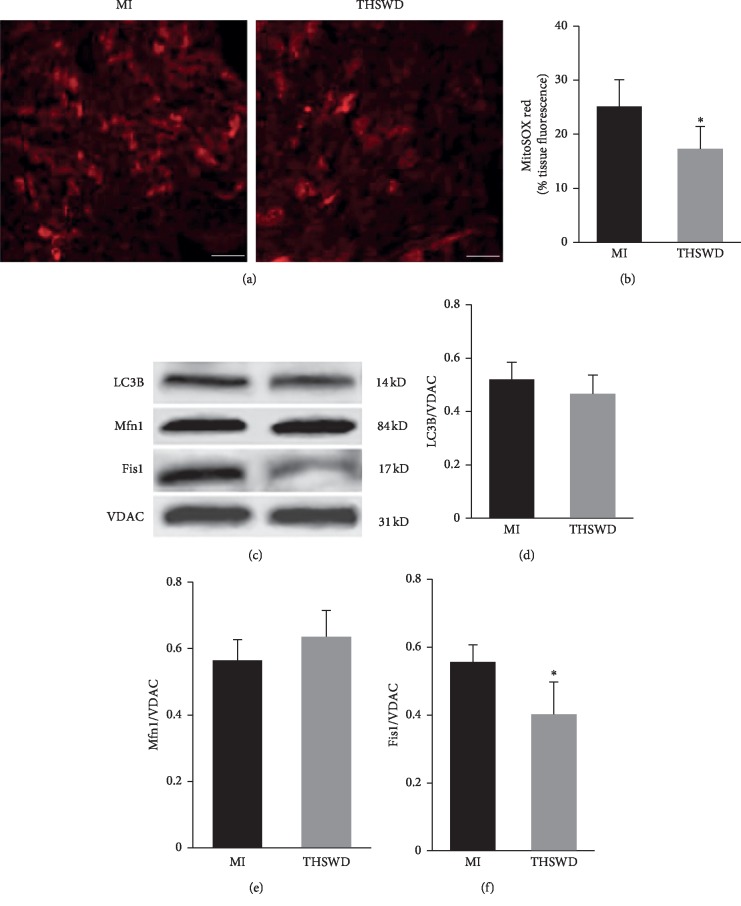
Figure 6.
Effect of THSWD on mitochondrial function, dynamics, and mitophagy. (a) The mitochondrial ROS production was measured by MitoSOX staining 7 days after THSWD treatment. Scale bar = 25 μm. (b) The level of MitoSOX red in the myocardial tissue was analyzed. (c) The protein expression levels of mitochondrial LC3B, Mfn1, and Fis1 were detected by western blot. (d–f) The semiquantitative data of western blots for LC3B, Mfn1, and Fis1. ∗P < 0.05 versus the MI group.

