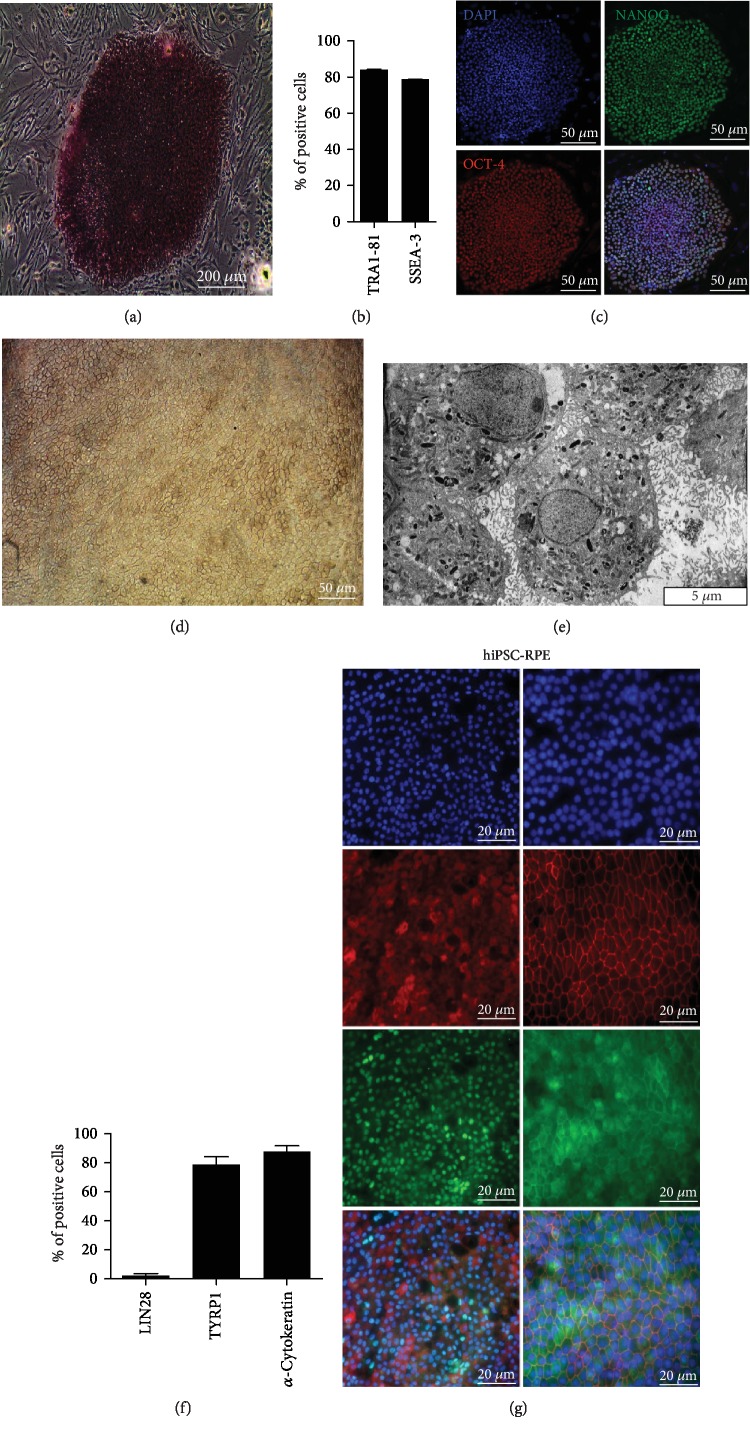
Figure 2.
Characterization of hiPSC and hiPSC-RPE cells. (a) Alkaline phosphatase activity of hiPSC. (b) Quantitative flow cytometry analysis of both typical embryonic stem cell surface markers TRA1-81 and SSEA-3. (c) Representative immunofluorescence analysis of pluripotency-specific markers of both stem cells NANOG and OCT-4. Nuclei were stained with DAPI. (d) Typical morphology of hiPSC-RPE cells. (e) Transmission electron microscopy analysis of RPE cells showing typical morphologic features such microvilli, mitochondria, and pigmentary granules. (f) Quantitative flow cytometry analysis of stem cell surface marker Lin 28 and of typical RPE cell surface markers TYRP1 and α-cytokeratin. (g) Representative immunofluorescence analysis of pluripotency-specific markers of typical RPE cell surface markers BEST-1, PAX6, ZO-1, and TYRP1. Nuclei were stained with DAPI.

