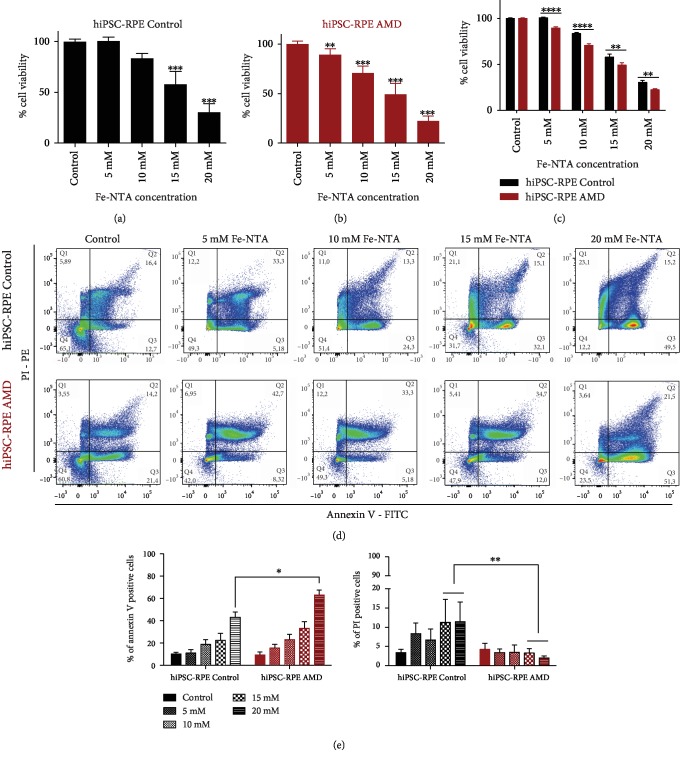
Figure 5.
Analysis of cell death in both hiPSC-RPE Control and AMD cells during oxidative stress exposure. Quantification by an MTT test of cell death induced by Fe-NTA treatment during 24 hours in both (a–c) hiPSC-RPE Control (N = 6) and (b, c) AMD (N = 6) cells (triplicate per cell line). Statistical analysis: one-way ANOVA, post hoc Dunnett and two-way ANOVA, and post hoc Bonferroni. ∗p < 0.05, ∗∗p < 0.01, and ∗∗∗p < 0.0001. (c) Flow cytometry analysis and (b) quantification of cell death pathway using annexin-V PI staining. Control (N = 4) and AMD (N = 6) (one analysis per cell line). Comparison of each dose between hiPSC-RPE Control and AMD cells for each dose. Control cells (N = 6) and AMD cells (N = 6) (triplicate per cell line). Statistical analysis: two-way ANOVA and post hoc Bonferroni. ∗p < 0.05, ∗∗p < 0.01, and ∗∗∗p < 0.0001.

