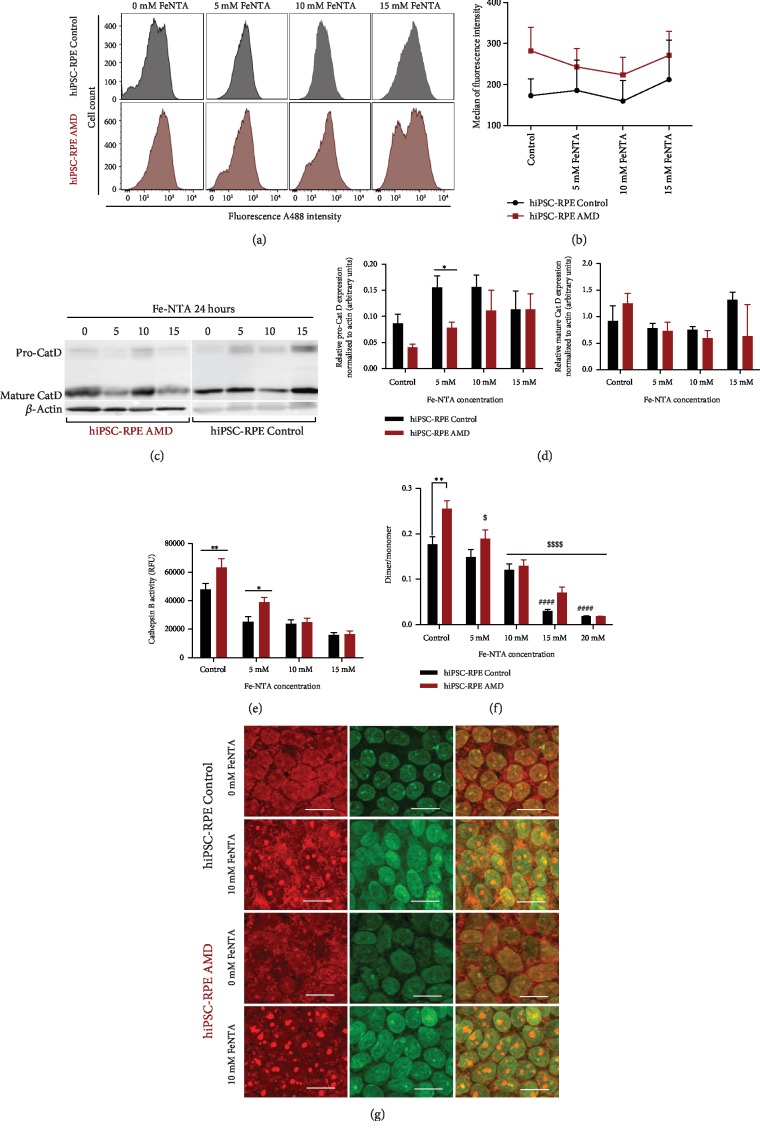
Figure 6.
Analysis of hiPSC-RPE lysosomal activity during oxidative stress induced by Fe-NTA treatment. (a) Flow cytometry analysis and (b) quantification of global lysosomal activity in both hiPSC-RPE Control (N = 5) and AMD (N = 6) cells (one analysis per cell line). Statistical analysis: two-way ANOVA and post hoc Bonferroni. (c) Western blot analysis of pro-Cat D and mature Cat D and (d) western blot quantification in both hiPSC-RPE Control cells (N = 6) and AMD cells (N = 6) (one analysis per cell line). Statistical analysis: two-way ANOVA and post hoc Fisher LSD. Comparison of each dose between hiPSC-RPE Control and AMD cells (∗). ∗p < 0.05. (e) Analysis of hiPSC-RPE Control cells (N = 6) and AMD cells (N = 6) cell Cat B activity (four analyses per cell line). Statistical analysis: two-way ANOVA and post hoc Bonferroni. Comparison of each dose between hiPSC-RPE Control and AMD cells (∗). ∗p < 0.05 and ∗∗p < 0.01. (f) Comparison of the ratio of the dimer or oligomer to the monomer of acridine orange in hiPSC-RPE Control (N = 6) and AMD (N = 5) cells (triplicate per cell line). ∗Comparison of each dose between hiPSC-RPE Control and AMD cells for each dose. $Comparison of each dose between basal condition for hiPSC-RPE Control and AMD cells. Statistical analysis: two-way ANOVA and post hoc Bonferroni. ∗,$p < 0.05, ∗∗,$$p < 0.01, and ∗∗∗,$$$p < 0.0001. (g) Lysosomal membrane stability was measured by AO staining under a fluorescence microscopy.

