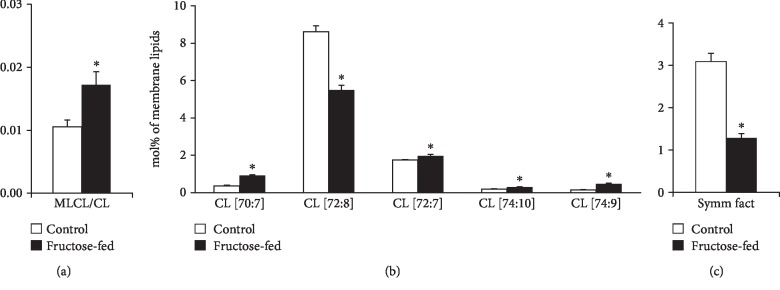
Figure 8.
Defects in cardiolipin remodeling. (a) Monolysocardiolipin to cardiolipin ratio (MLCL/CL). (b) Changes in CL species due to fructose feeding. (c) CL symmetry factor calculated as the ratio of symmetric/asymmetric CL species. ESI-MS data are expressed as mol% of membrane lipids or calculated from the corresponding values and presented as means ± SEM (n = 8), ∗p < 0.05.

