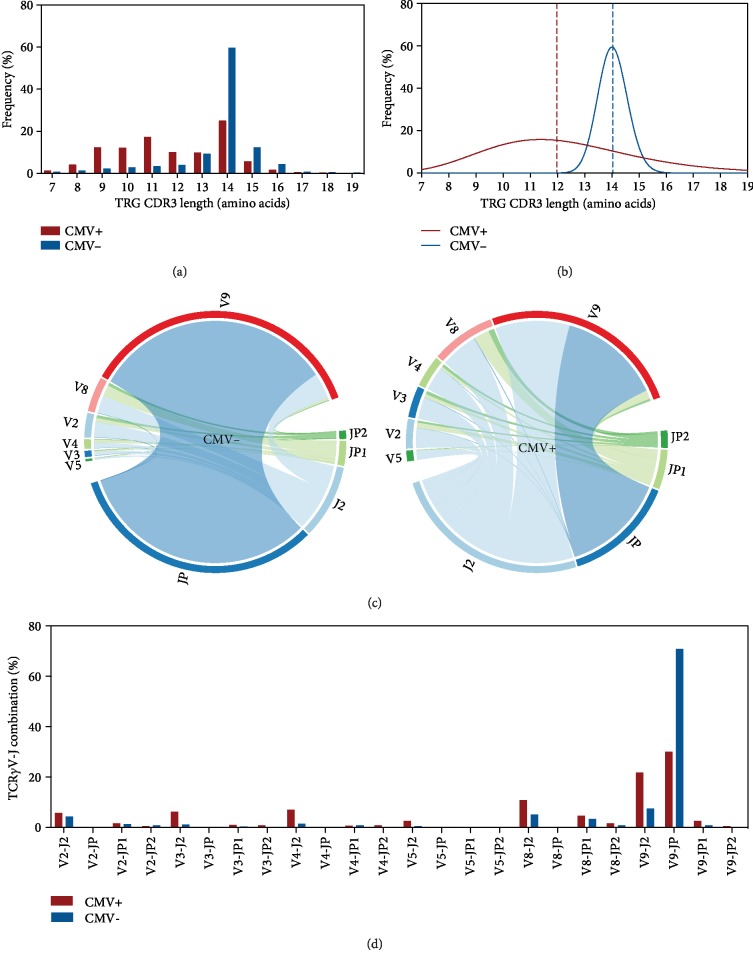
Figure 5.
CMV positivity is associated with TRG reshaping and V-J segment usage changes. (a) TRG spectratype. Bars represent the frequency of unique CDR3 sequences with different amino acid lengths in a CMV+ and CMV- graft donor. (b) The distribution pattern of the clonotypes shown in (a). Lines represent the nonlinear curve fitting (Gauss function) in each donor. The vertical line indicates the median length in each donor. (c) V-J segment pairing abundance in CDR3 junctions of each donor based on CMV status. Chord diagrams are used for visualization. Ribbons connecting segment pairs are scaled by corresponding V-J pair frequency. (d) The frequency of different TRGV-TRGJ rearrangements shown in (c). Bars represent the usage of a given V-J junction in each graft.

