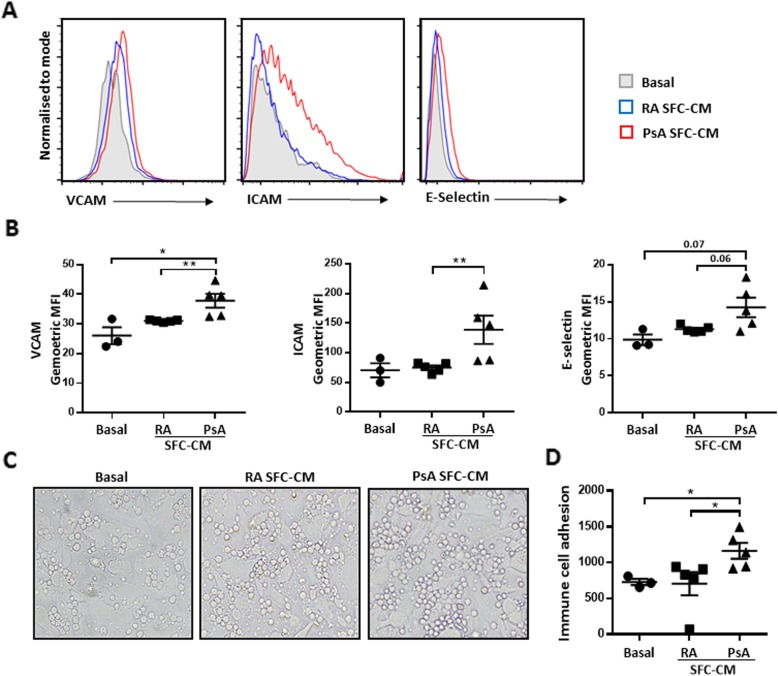
Fig. 3.
SFC-CM-induced surface expression of adhesion markers and immune cell adhesion to HUVEC. a Representative histograms of surface adhesion marker expression (VCAM, ICAM, and E-Selectin) on HUVEC in response to control culture media, RA SFC-CM, and PsA SFC-CM. b Bar graphs quantifying the surface expression of VCAM, ICAM, and E-Selectin following exposure to control culture media (n = 3), RA SFC-CM (n = 5), and PsA SFC-CM (n = 5). c Representative photomicrographs of PBMC adhesion to HUVEC in response to control culture media (n = 3), RA SFC-CM (n = 5), and PsA SFC-CM (n = 5). d Bar graph representing corresponding semi-quantification of PBMC adhesion to HUVEC. Data are expressed as mean ± SEM. *p < 0.05, **p < 0.01 significantly different

