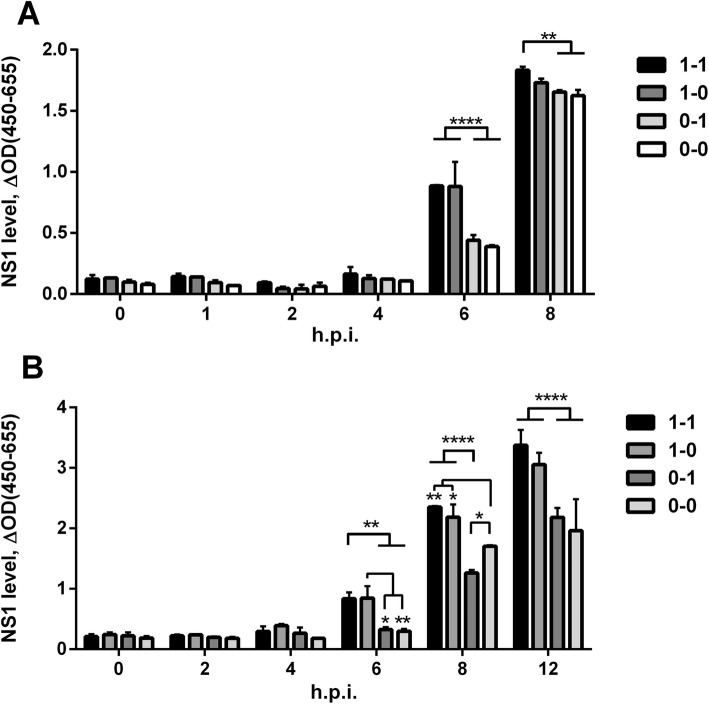
Fig. 5.
NS1 expression in cells infected by assembled viruses featuring different NS RNA structures. MDCK (a) or A549 (b)cell cultures were infected with virus at moi = 10 TCID50/cell. Infected cells were fixed at the indicated time points, and NS1 protein levels were analyzed by ELISA. Error bars represent mean ± SD. Differences were analyzed by two-way ANOVA with Tukey’s multiple comparisons test (**p < 0.001, ****p < 0.00001)

