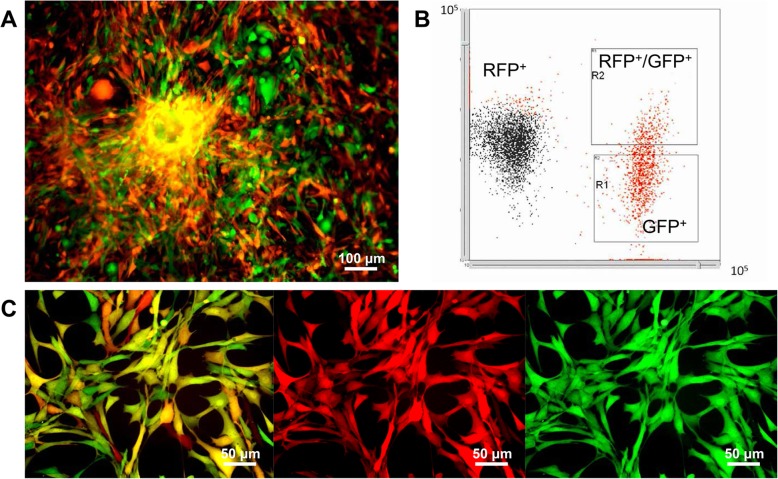
Fig. 2.
Fluorescent cell sorting. a: Fluorescence image of primary culture of SU3-RFP xenograft tumor tissue-derived cells showing both SU3-RFP cells (red) and bone marrow-derived GFP+ cells; b: flow cytometry was used to detect the ratio of RFP+, GFP+ and RFP+/GFP+ cells, the ratio of RFP+ cells, GFP+ cells, and RFP+/GFP+ cells was 63.22 ± 5.10%, 28.22 ± 5.96%, and 9.48 ± 1.54%, respectively; c: SU3-RFP cells showed red fluorescence, host cells showed green fluorescence. Cells co-expressing RFP and GFP were detected in the merged image indicating tumor-host cell fusion. Scale, A 100 μm; C 50 μm

