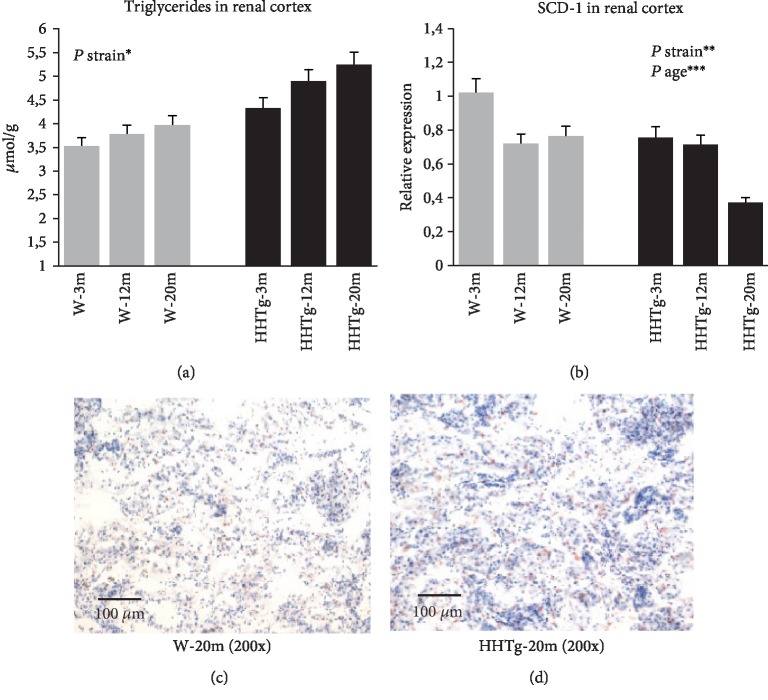
Figure 2.
Concentrations of triglycerides (a) and relative gene expression of SCD-1 (b) in the renal cortex. Histological comparison of the kidneys of Wistar control (c) and HHTg (d) rats at 20 months of age. Data are expressed as mean ± SEM and analysed by two-way ANOVA; ∗ denotes P < 0.05, ∗∗ denotes P < 0.01, and ∗∗∗ denotes P < 0.001. HHTg: hereditary hypertriglyceridemic rats, W: Wistar control rats, SCD-1: stearoyl-CoA desaturase.

