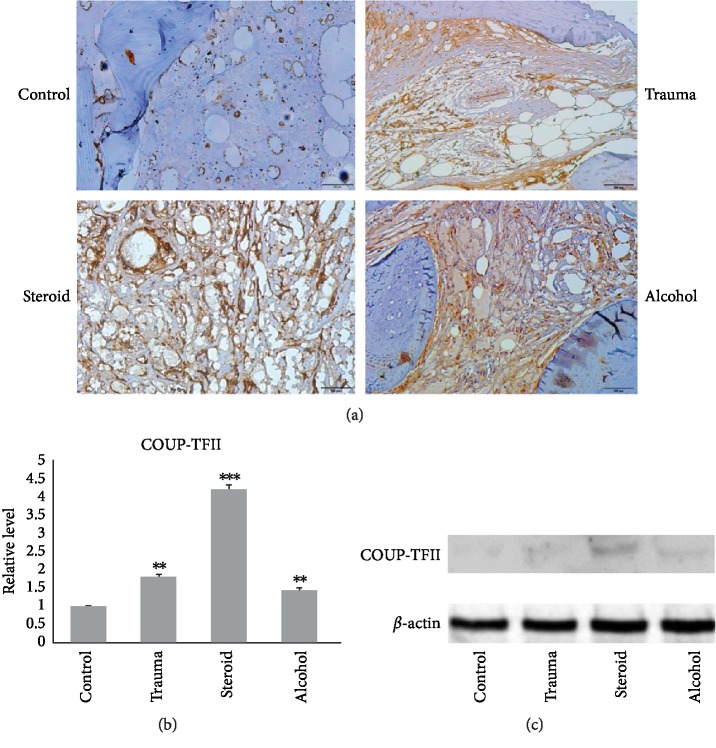
Figure 3.
(a) Immunohistochemical images (200x) of osteonecrotic tissue showing COUP-TFII expression in the bone specimens. In the osteonecrotic groups, osteonecrotic lesions displayed strong COUP-TFII expression compared with those in the control group. (b and c) Western blot analysis showed increased expression of COUP-TFII in all the osteonecrotic groups compared with the control group. (Data are means ± SD; t test, ∗P < 0.05, ∗∗P < 0.05, ∗∗∗P < 0.001, and the difference was statistically significant compared with the control group.)

