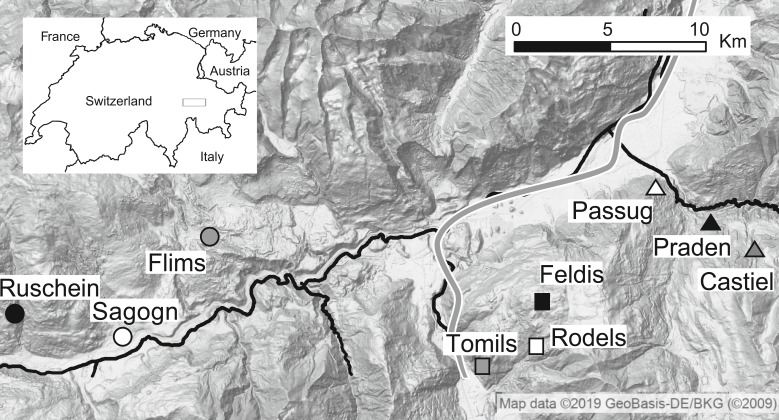
Figure 1. Location of tick sampling sites in the Swiss Alps.
Different shapes (i.e., circle, square and triangle) represent the different locations and different colours represent elevation (white: low, grey: middle, black: high). Rivers and motorway are shown in black. Map data ©2019 Google, GeoBasis-DE/BKG.

