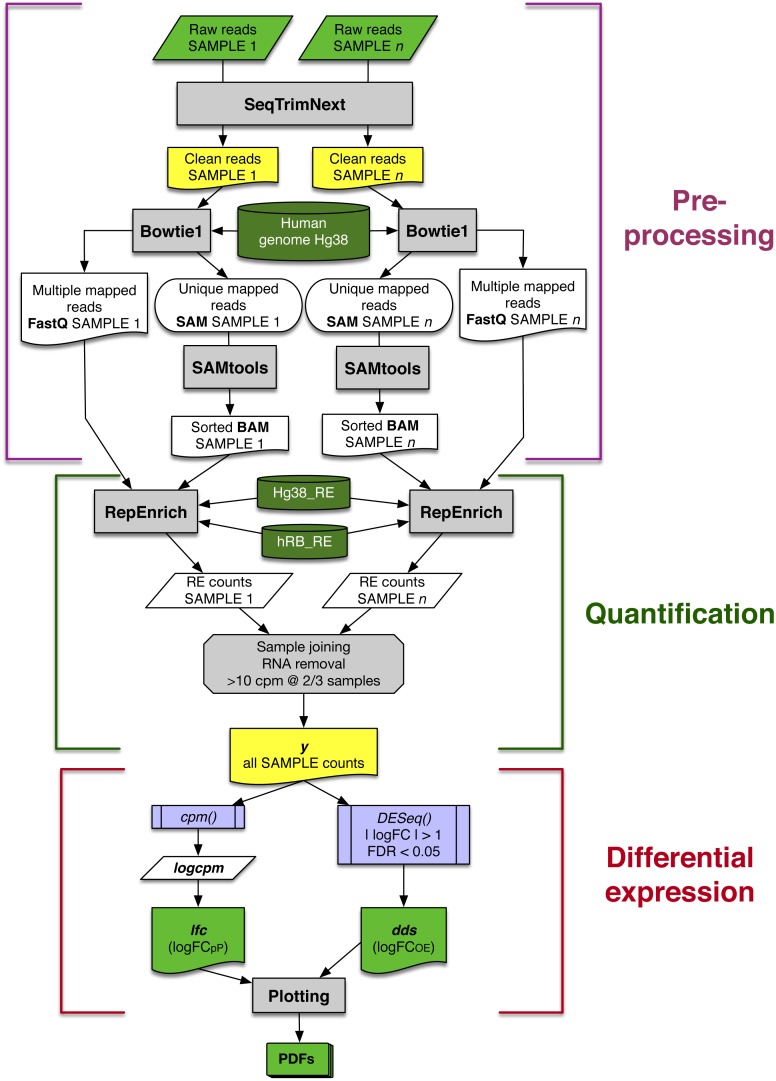
Figure 1. Schematic workflow for assessing differential expression of REs from matched-sample raw reads developed in this study.
Each main block is explained in detail in the main text. Grey rectangles indicate bioinformatic tools and filters; lilac boxes correspond to R functions; green and yellow boxes are relevant input or output data to be saved; and dark green cylinders refer to databases.

