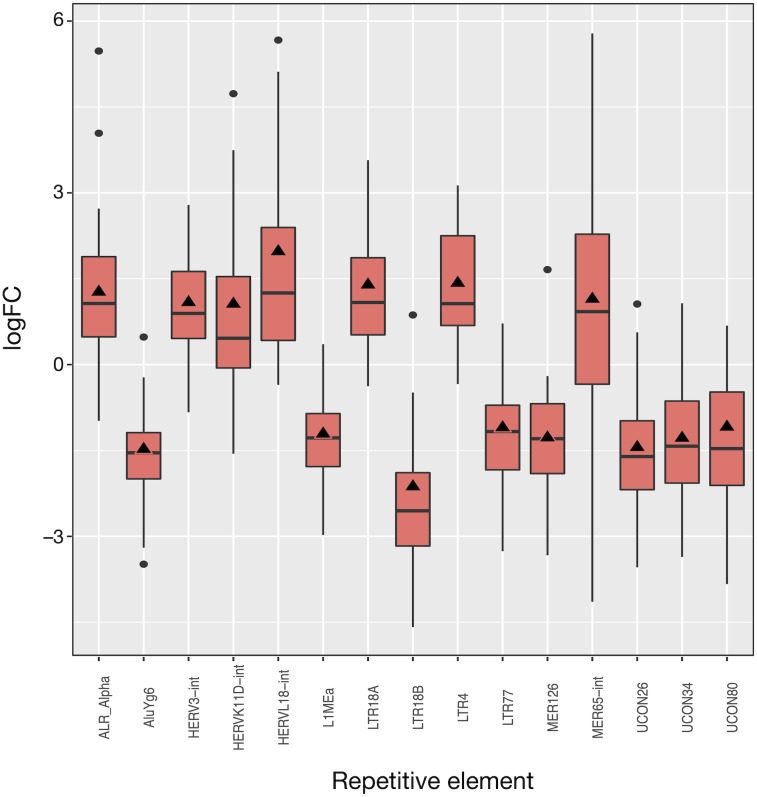
Figure 3. Expression distribution of the 15 differentially expressed REs in LUAD patients. Alphabetically ordered names are at the x axis, and the y axis corresponds to the binary logarithm of expression fold-change (logFC).
Boxes and whiskers correspond to logFCpP values, where black dots are outliers, while triangles denote the logFCOE (see Table S2). Note that all triangles (representing logFCOE) are within the interquartile rage (IQR) of logFCpP values, usually close to median, indicating that the single measure considering all patients (logFCOE) is consistent with the distribution of RE expression changes for all patients (logFCpP), but is less informative.

