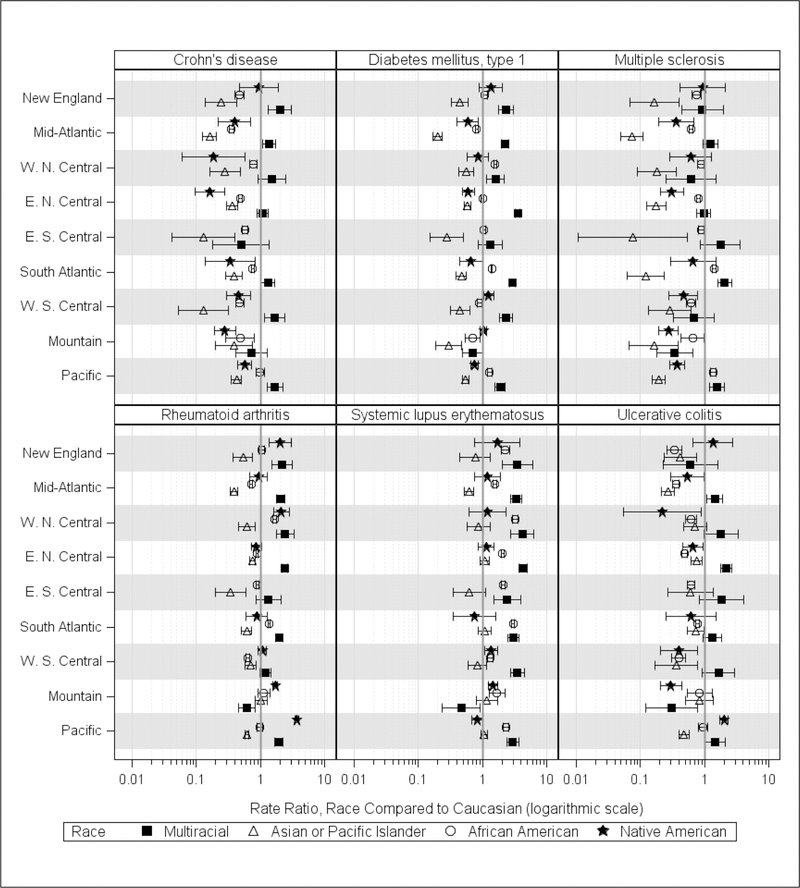
Figure 5.
Standardized AID Rate Ratios for AIDs with Overall Observed Rates of 50 per 100,000 or Higher, Minority Race vs Caucasian, by Census Division, United States, 2010–2016
E, east; N, north; S, south; W, west
Depicted are the standardized age-adjusted observed rate ratios, estimated from the Health Facts database population for the years 2010–2016, for each race vs Caucasian within each US Census Division, and the associated 95% confidence intervals for the ratios. US Census Regions/Divisions and states included are: Northeast/New England (CT, ME, MA, NH, RI, VT); Northeast/Middle Atlantic (NJ, NY, PA); Midwest/West North Central (IA, KS, MN, MO, ND, SD); Midwest/East North Central (IL, IN, MI, OH, WI); South/East South Central (AL, KY, MS, TN); South/South Atlantic (DE, DC, FL, GA, MD, NC, SC, VA, WV); South/West South Central (AR, LA, OK, TX); West/Mountain (AZ, CO, ID, MT, NV, NM, UT, WY); West/Pacific (AK, CA, HI, OR, WA). There were no observations identified for MS for Native Americans in the East South Central Census Division, and only 3 or less for diabetes mellitus type 1, rheumatoid arthritis, and systemic lupus erythematosus.

