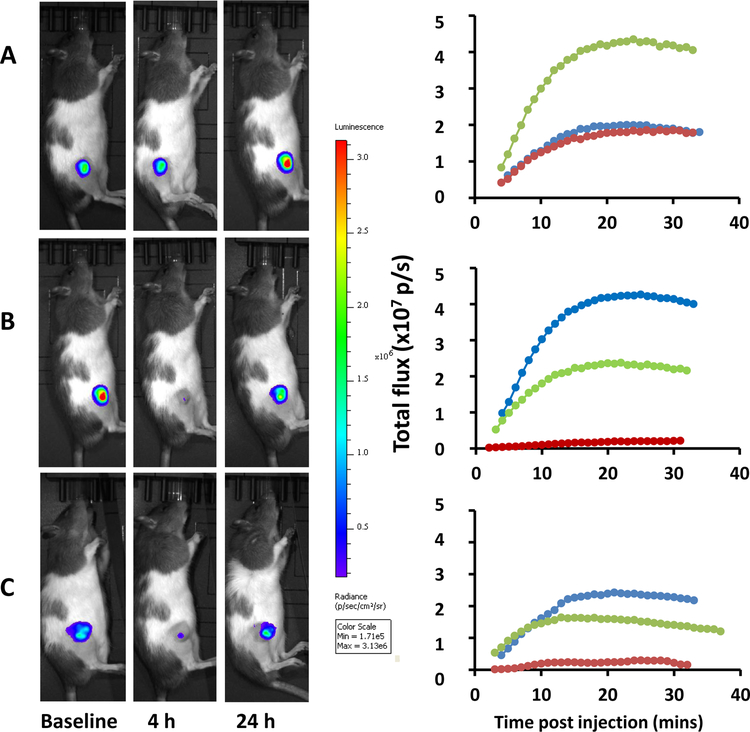
Figure 4.
BLI assessment of vascular response to VDA. Left) Heat maps overlaid on photographs of male Copenhagen rat with subcutaneous PC3-DAB2IP-luc human prostate tumor xenograft showing light emission about 20 min after administration of D-luciferin (120 mg/kg) at various times with respect to VDA administration IP. Right) Corresponding dynamic light emission curves acquired over about 30 min following luciferin administration. Blue shows baseline; red about 4 h after VDA and green at 24 h. A) 10 mg/kg compound 69 indicating no vascular perturbation, but increased signal at 24 h consistent with rapid tumor growth. B) 6 h later 40 mg/kg compound 69 was administered to the same rat generating about 95% reduced signal at 4 h, consistent with substantial vascular shutdown and showing substantial recovery by 24 h. C) Four days later 30 mg/kg CA4P was administered to this rat eliciting BLI response similar to the BLI response shown in B.

