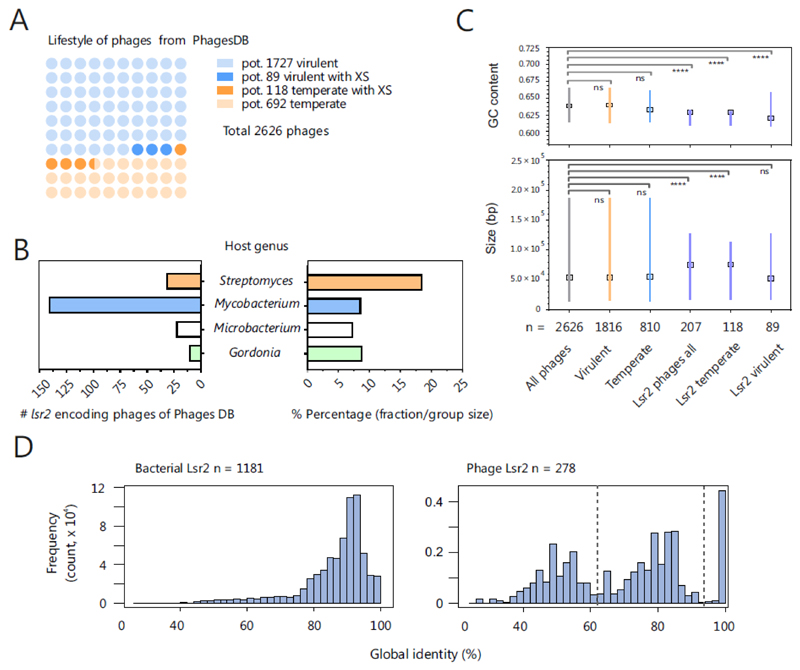
Figure 2. Lsr2-like proteins are encoded on actinobacteriophage genomes.
A. Distribution of Lsr2-encoding phages is shown among temperate and virulent actinophages. Based on the genomes downloaded from the actinobacteriophage database PhagesDB [83], coding sequences were predicted by prodigal [101] and the lifestyles of phages were predicted using PHACTS [85]. The temperate lifestyle was assigned if the mean minus the standard deviation of the calculated probability was >0.5. Otherwise, a virulent lifestyle was assumed. By this approach, 1816 (1727 corresponding to light blue and 89 corresponding to blue balls) were predicted to be virulent and 810 (692 light orange and 118 corresponding to orange balls), to be temperate (out of 2626 phages, downloaded 19.10.2018). A blastp search (default parameters, e-value < 0.005) revealed 207 phages encoding Lsr2-like proteins, of which 89 (blue balls) are virulent and 118 temperate phages (orange balls). Phages containing more than one gene encoding an Lsr2-like protein were counted only once; hits found in draft genomes were excluded. B. Overview of the host genus of Lsr2-encoding phages. On the left side, the absolute numbers are indicated. The right side of plot shows the proportion of Lsr2-encoding phages among all phages for the respective host genus. C GC contents and sizes of temperate, virulent and silencer encoding phages were compared with reference group (all phages) by the Kruskal-Wallis test. The medians are indicated with boxes. In the GC-content plot, the lines represent the interquartile ranges, whereas in the size plot, the lines indicate the range of the minimal and maximal values. D. Global pairwise secondary structure identity between Lsr2 sequences encoded in bacterial (left side) and phage genomes (right side). The identity of Lsr2 structure within bacterial genomes is relative high (mean ~87%) compared to the phage encoded Lsr2 sequences (mean ~70%). Furthermore, the distribution of the phage encoded Lsr2 structure identity evinces a higher diversity by pointing to the existence of particular pairs with high identity to each other and low to the rest of the data set.

