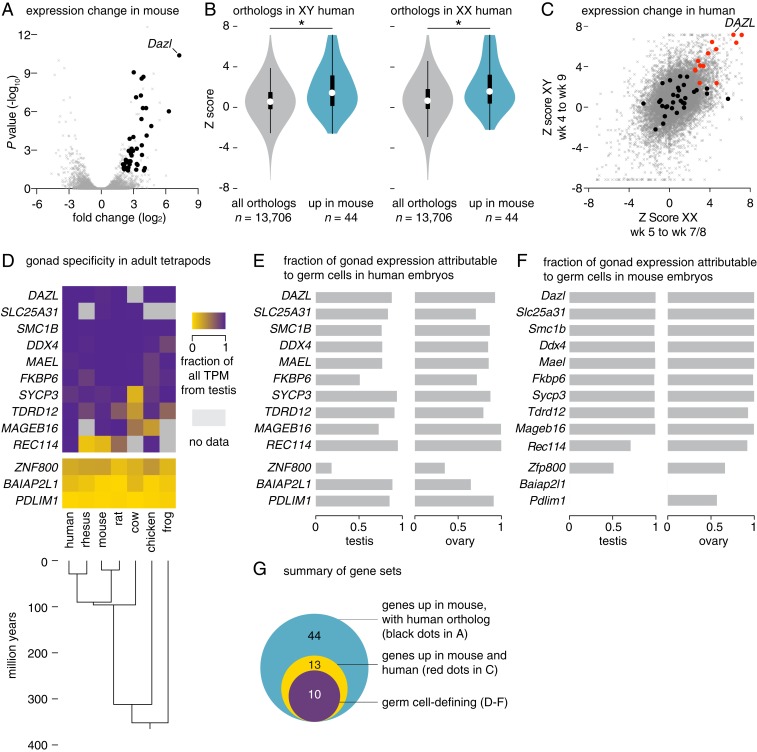
Fig. 1.
A conserved program of germ cell transcription is induced upon PGC colonization of nascent gonads in mice and humans. (A) Gene expression changes in mouse germline between E9.5 and E11.5, as measured by RNA-seq. Black dots denote 44 genes that are up-regulated and have single human orthologs (fold change > 4, FDR value < 0.05); gray dots denote all other expressed genes (n = 11,282). (B and C) Gene expression changes in XY and XX human embryonic germlines between weeks 4 and 9, as measured by single cell RNA-seq. (B) Violin plots; as a set, genes induced in mouse germline (from A, n = 44) show greater expression increases in XY (Left) and XX (Right) human germline after PGCs colonize the gonads than do the set of all expressed orthologs (n = 13,706; *P value < 0.0007 by Wilcoxon rank sum test; black bar, interquartile range; circle, median value). (C) Scatter plot; black and red dots denote genes robustly up-regulated in mice, and possessing a single human ortholog (from A, n = 44); red dot genes are also significantly up-regulated in both XY and XX human germlines (n = 13). Gray dots denote all other expressed genes. (D) Heatmap; summary of gonad specificity of commonly up-regulated genes (red dots in C, n = 13), by RNA-seq, in 9 adult tissues from 7 tetrapods. Specificity fraction is determined by dividing testis expression (in TPM, transcripts per million) by sum of expression in all analyzed adult tissues, for each species. Genes with no annotated ortholog are shown in gray. (E and F) Germ cell expression of commonly up-regulated factors (red dots in C, n = 13) in (E) human embryonic testis and ovary and (F) mouse E14.5 testis and ovary by RNA-seq (SI Appendix, SI Materials and Methods). Ratio of 1 indicates germ cell-specific expression; 0 indicates somatic cell expression. (G) Euler diagram of gene sets identified through analyses in A–F.

