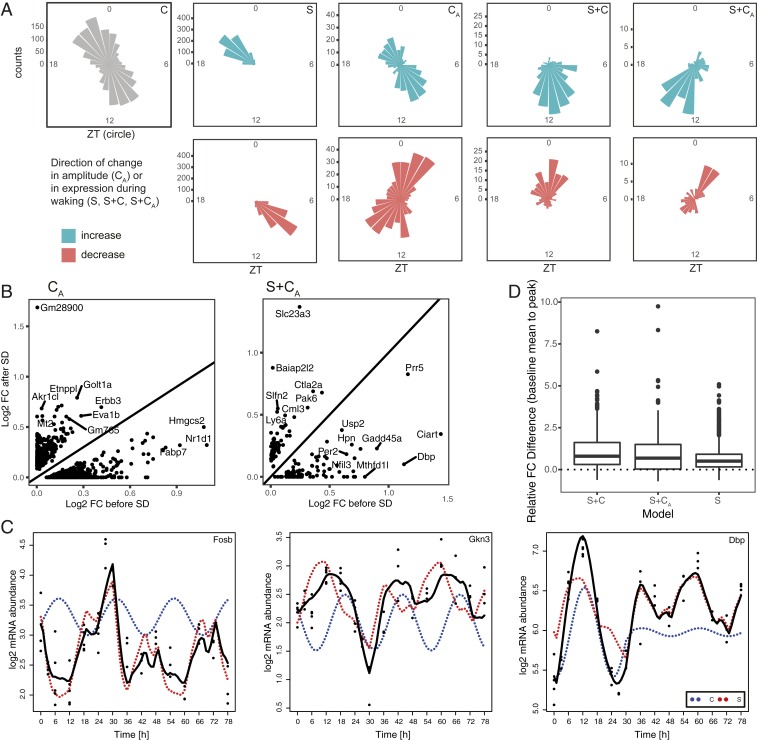
Fig. 4.
Contribution of the S and C components to phase and amplitude of oscillating genes under baseline and after SD. (A) Phase maps of non-F model genes. Each cone reflects the number of genes peaking during 1 h around the ZT clock. Non-C model genes are divided according to the direction of change of the amplitude after SD (CA), or the direction of the change in expression occurring under wakefulness (S, S+C, S+CA). (B) Scatter plots of the log2 amplitude before and after SD of the C component for models CA and S+CA. (C) Contribution of the S and C components (red and blue dotted curves, respectively) to the overall fitted temporal gene expression profile (solid black curve) of 3 example genes. (D) Difference between the highest point before and after SD, both compared to the baseline average, for models S, S+C, and S+CA.

