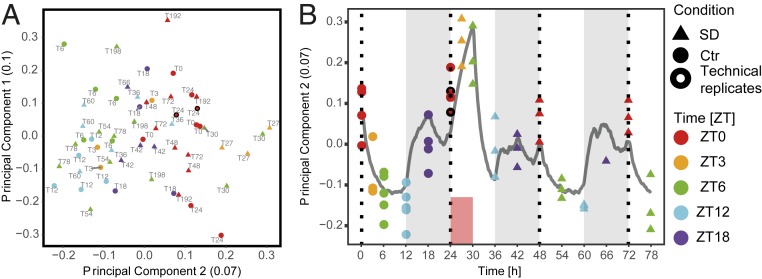
Fig. 6.
Chromatin accessibility shows sleep–wake-driven dynamics and a rapid response to SD. (A) PCA of all detected ATAC-seq peaks. Plot features as in Fig. 2A. A black symbol outline highlights technical replicates. (B) PC2 plotted over time. Color and shape code as in A. Gray line is sleep–wake-driven simulation of process S with the same time constants used to predict EEG δ-power dynamics (Fig. 1B).

