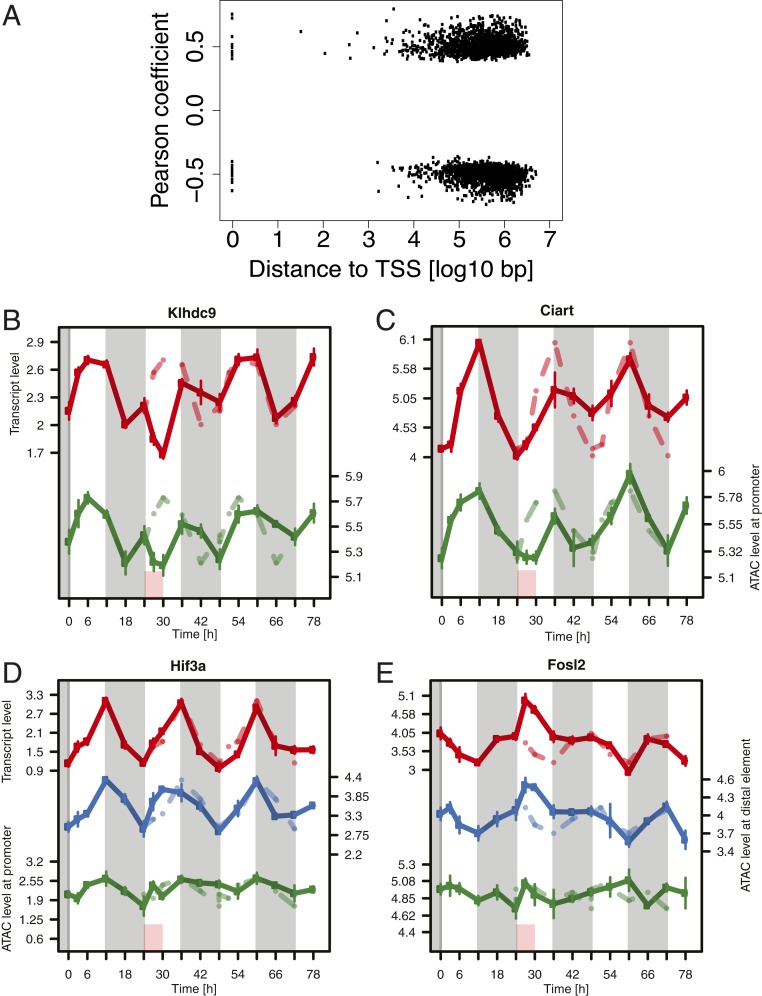
Fig. 7.
Gene expression predominantly correlates with the dynamics of distal accessible genomic regions rather than promoters. (A) Distance from ATAC-seq peak to the associated TSS. (B–E) Temporal patterns of gene–peak associations (with promoter for genes associated with distal elements). Red: RNA-seq signal. Blue and green: ATAC signal of the distal element, respectively promoter, of the associated gene. Red box is SD. Gray shading is dark phase of the light–dark cycle. Baseline data are repeated over the entire time course as a stippled line.

