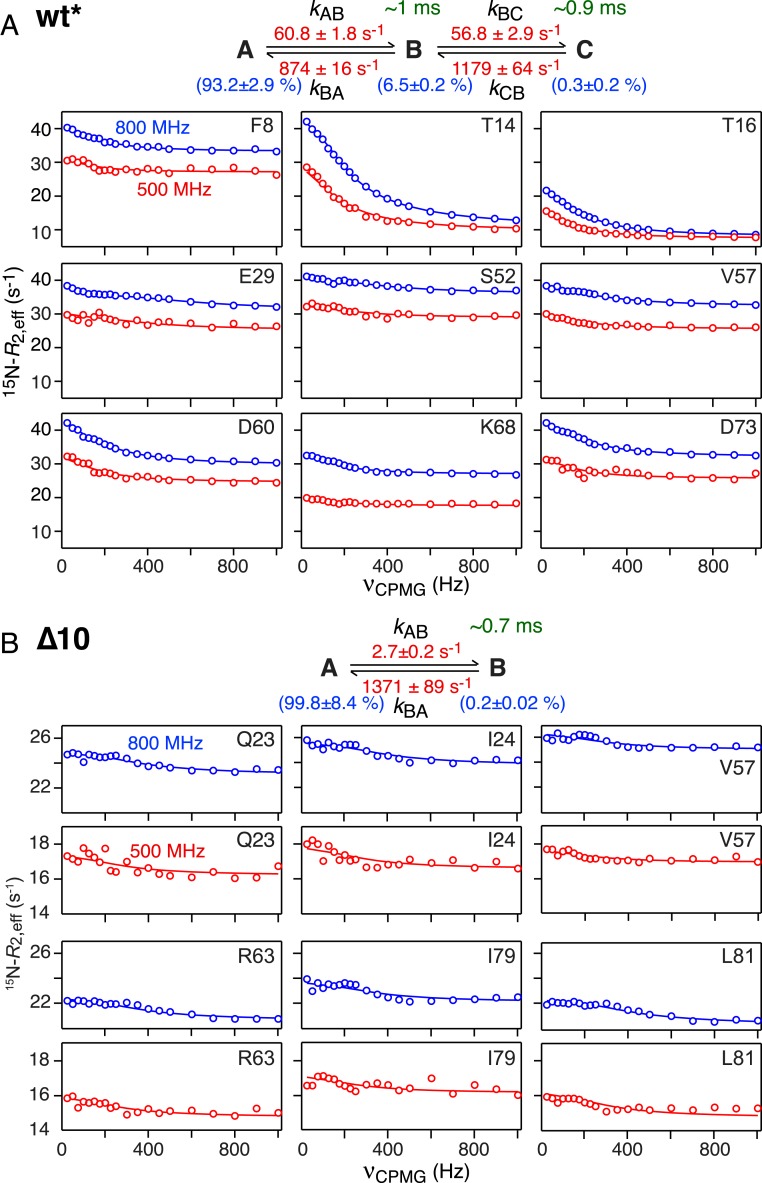
Fig. 5.
Nitrogen-15 CPMG relaxation dispersion measurements on wt* and Δ10 ngMinE constructs. (A) wt* and (B) Δ10. Representative experimental data (recorded at 25 °C) are shown as circles (blue, 800 MHz; red, 500 MHz) and the best-fit curves to a 3-state linear scheme for wt* and a 2-state scheme for Δ10 are shown as continuous lines. The rate constants (in red), species populations (in blue), and lifetimes of the excited states (in green) are also indicated.

