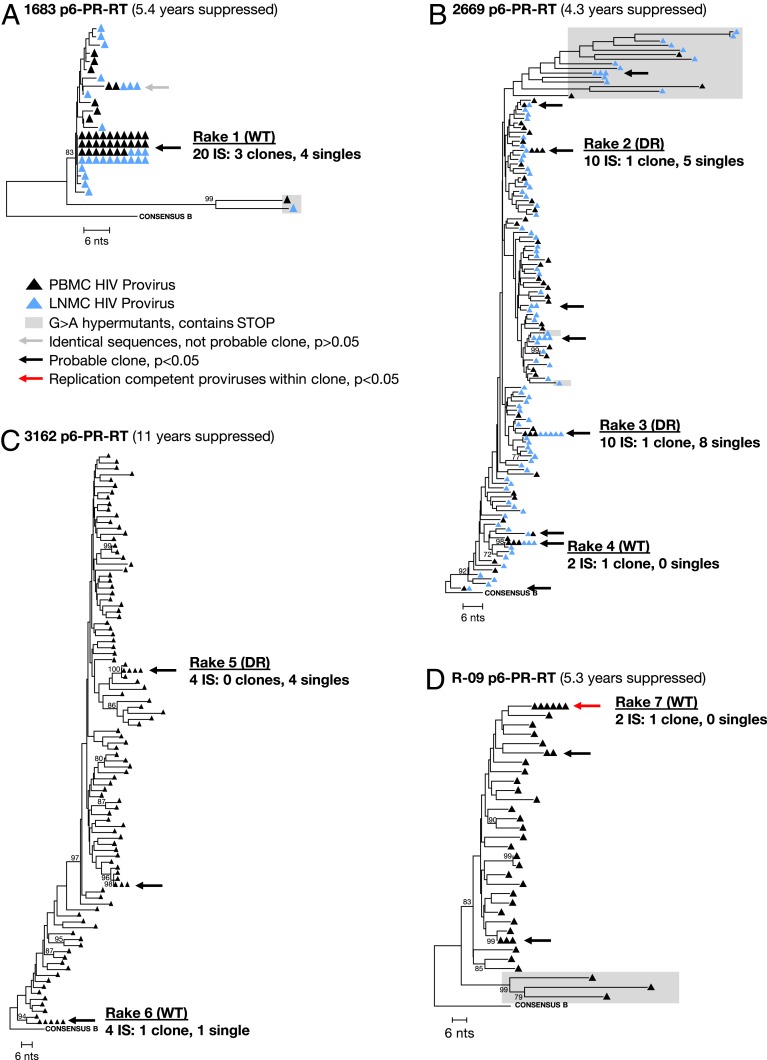
Fig. 4.
Neighbor-joining trees of viral sequences obtained from donors on ART. SGS of P6–PR–RT region of viral DNA from SCOPE donors 1683 (A), 2669 (B), 3162 (C), and Pitt donor R-09 (D). Average pairwise distance: 0.2%, 1.6%, 2.7%, and 1.9%, respectively. The gray arrow indicates a group that had fewer than the number of identical sequences expected by chance (P > 0.05); the black arrows indicate groups with more than the expected number of identical sequences, and the red arrow indicates groups that matched variants that grew out in VOA. Groups that were investigated for clonality are labeled rake #1 to #7. Within each group, the number of total integration sites, confirmed expanded clones, and single integration sites are given. Integration site (IS), wild type (WT), and drug-resistance mutations (DR). Bootstrap values are shown for nodes with greater than 70% confidence.

