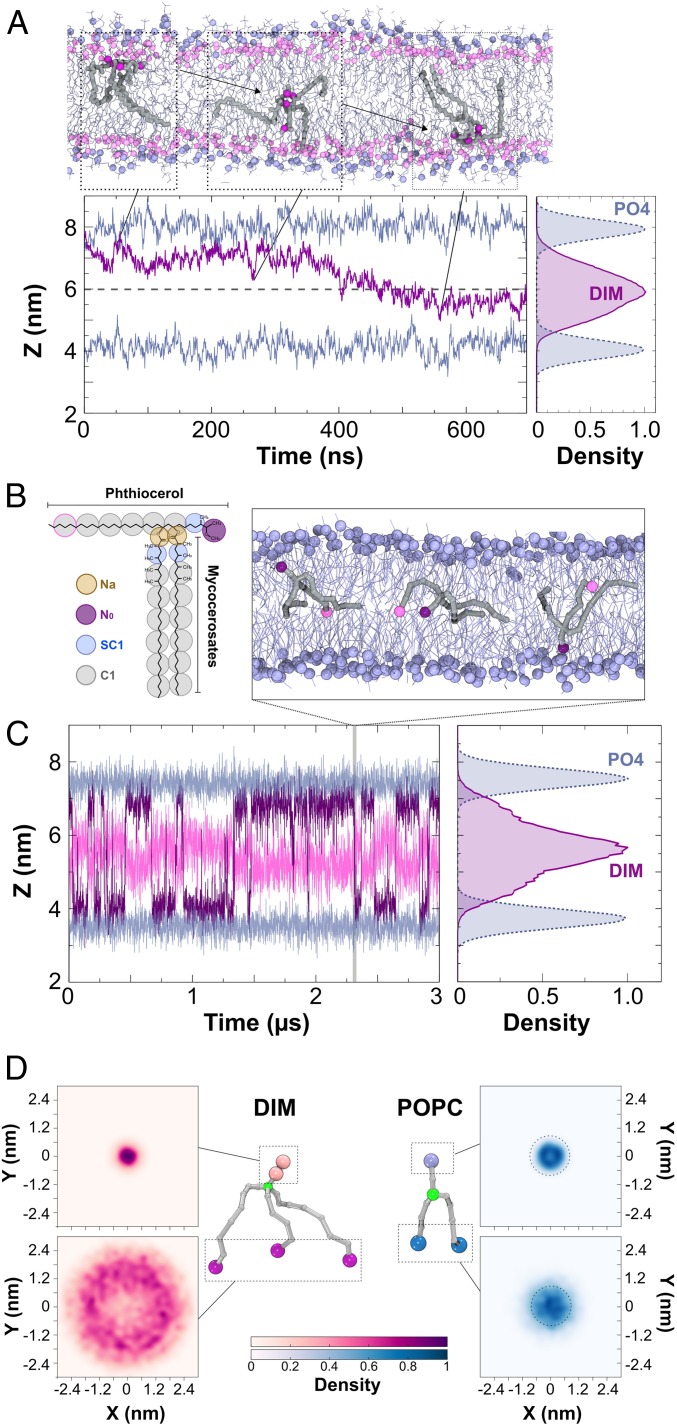
Fig. 2.
Position and shape of a single DIM molecule in a POPC bilayer. (A, Top Inset) Atomistic simulation of a DIM molecule (in gray licorice) showing its passage from one leaflet of the POPC bilayer to the opposite one. DIM oxygen atoms are represented in purple, POPC phosphorous atoms are displayed in light blue, and POPC oxygen atoms in pink. (A, Bottom Left) In purple, evolution of the z-position for the center of mass of DIM’s oxygen atoms during the course of the atomistic simulation. In light blue, averaged z-position of the phosphorous atoms of the POPC molecules. (A, Bottom Right) Densities of the positions of the DIM lipid and POPC phosphate groups revealing the embedded DIM position in the bilayer. (B) Coarse-grained model of the DIM molecule (see Materials and Methods and SI Appendix, Fig. S3 for details). (C) Evolution of N0 and the last C1 particles on the phthiocerol moieties (in purple and pink, respectively) during the course of the CG simulation. This plot shows a C1 particle confined around the interleaflet space while the N0 particle stayed in the proximity of the POPC oxygen atoms. (Top Inset) DIM (in gray) transit from one leaflet to the other during CG simulation. (Right Inset) Densities of the DIM lipid and POPC phosphate groups. (D) The 2D density projections of each extremity for DIM and POPC molecules in the x–y membrane plane (CG simulation) (see also SI Appendix, Fig. S5 displaying densities for atomistic simulations), highlighting the conical shape of DIM and the cylindrical shape of POPC, respectively. Particles depicted in green were used for molecule centering.

