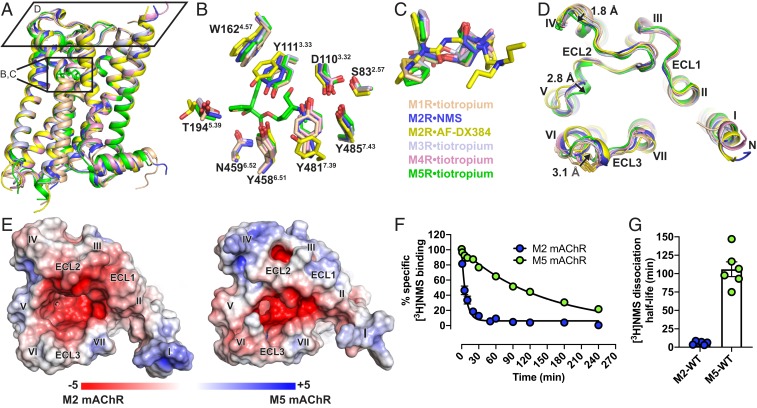
Fig. 2.
Structural comparison of M1 to M5 mAChRs. (A) The overall view of the M1 to M5 mAChR structures aligned with the M5 mAChR and shown as cartoons. M1•tiotropium is colored peach (PDB ID code 5CXV), M2•NMS in dark blue (PDB ID code 5ZKC), M2•AF-DX384 in yellow (PDB ID 5ZKB), M3•tiotropium in light blue (PDB ID 4U15), M4•tiotropium in pink (PDB ID 5DSG) and M5•tiotropium in green (PDB ID 6OL9). (B) Comparison of residues (stick representation) lining the orthosteric site with tiotropium from the M5 mAChR displayed and (C) overlay of the orthosteric ligands. (D) View from the extracellular surface comparing differences in the ECL regions across the M1 to M5 mAChRs. Distances between the backbone of M1 and M5 mAChR residues in ECL2 and ECL3 are shown and indicated by arrows. (E) Electrostatic and surface potential of M2 and M5 mAChR (+5kT/e in blue and −5kT/e in red) mapped on the surface of the receptors calculated at pH 7.0. (F) Comparison of dissociation rate and (G) dissociation half-life of [3H]NMS by the addition of 10 µM atropine at the M2 and M5 mAChRs. Values are significantly different (P value < 0.0001, 2-way ANOVA). Detailed statistical analysis is shown in SI Appendix, Table S5.

