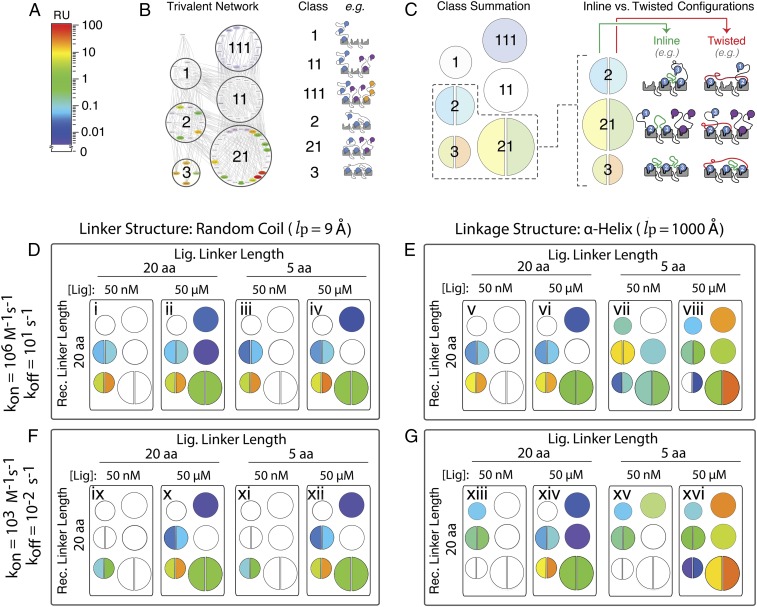
Fig. 4.
Mapping of a cross-section of the multidimensional, trivalent receptor–ligand interaction space details the parameter sensitivities of the multivalent effect. Overview of simplified representation: Microstate concentrations (A) were binned based on “class” of interaction (B) and represented as a summed color intensity with inline and twisted microstate conformations separately indicated for the 3 classes in which they occur (C). Sampling of the parameter space for simulated trivalent–trivalent interactions after a 50-s association with a monovalent KD = 10 mM of either fast on/off (D and E) or slow on/off (F and G). Linkers were either flexible “random coil” (D and F) or rigid “alpha-helical” (E and G), each with lengths of either 20 or 5 amino acids. Ensemble simulations were performed with low (50 nM) or high (50 μM) ligand concentrations.

