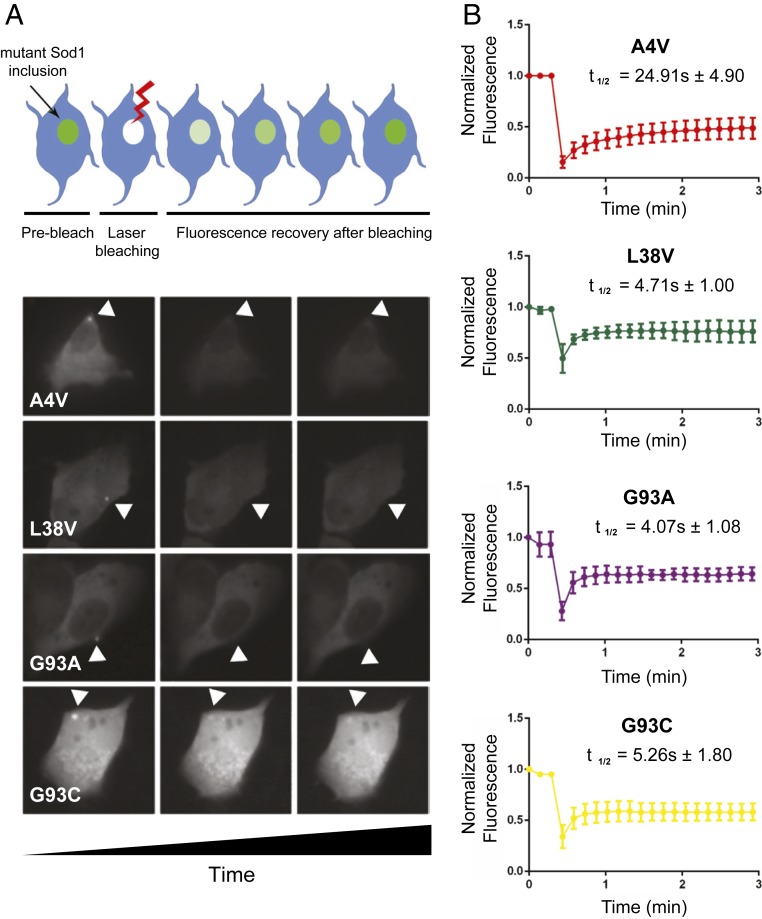
Fig. 2.
Interaction dynamics of mutant Sod1 heterodimers in H4 cells. (A) In the Upper part, schematic illustration of FRAP of an inclusion of interest. At the Bottom, from left to right: a panel with 3 images of a representative cell expressing the heterodimer inclusion before photobleaching, just after photobleaching, and at the end of image acquisition. (B) FRAP recovery curves for heterodimers inclusions of VN–WT and mutant Sod1–VC. For each mutation, at least 6 inclusions in different cells were analyzed. Each plot represents mean ± SD for each time point for all FRAP experiments.

