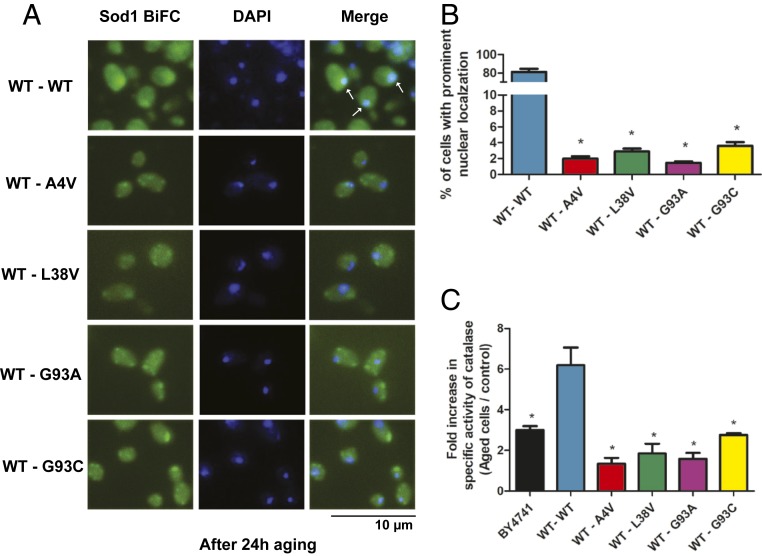
Fig. 8.
hSod1 nuclear localization is impaired by fALS-linked mutations after aging. (A) hSod1 WT and mutant heterodimers were imaged by fluorescence microscopy after aging. Inclusions of Sod1 were visualized by expression of BiFC-tagged Sod1 (green), and the nucleus was stained by DAPI (blue). Arrows indicate the colocalization of the hSod1 with the nucleus, induced by the aging process. (Scale bar, 10 µm.) (B) Percentage of cells with prominent Sod1 nuclear localization. Error bars indicate ±SD of triplicates and at least 50 cells were counted per replicate. One asterisk represents statistically different results between mutant heterodimers with the WT hSod1 form (BY4741 or mutant hSod1 vs. WT hSod1). (C) Catalase activity results were expressed as a fold increase in specific activity (U/mg of protein) after chronological aging. One unit (U) of activity is defined as the amount of enzyme that catalyzes the consumption of 1 µmol H2O2/min under the assay conditions. The results represent the mean ± SD of at least 3 independent experiments. One-way ANOVA, with Bonferroni correction, was used for statistical analysis with significance level of *P < 0.05 (WT vs. mutant cells or BY4741).

