Fig. 3.
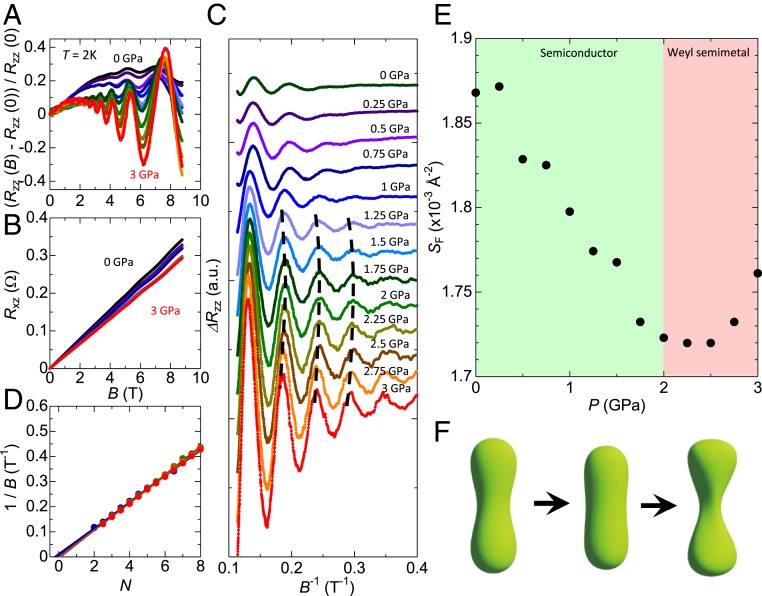
SdH oscillations of sample 2 (EF < Ec). (A and B) Magnetoresistance (A) and Hall effect (B) of sample 2 at T = 2K under various pressure. (C) Oscillating components of the resistance. (D) Landau index plot of sample 2. (E) Pressure dependence of the cross-sectional area of Fermi surface estimated from the periods of oscillations. SF shows the anomaly around P = 2 GPa similarly to sample 1 (Fig. 2E). (F) Pressure evolution of the calculated 3D Fermi surface for the sample with EF = 5 meV at ambient pressure. From the left figure, P = 0 GPa, P = 1.22 GPa, and P = 2.62 GPa, respectively.

