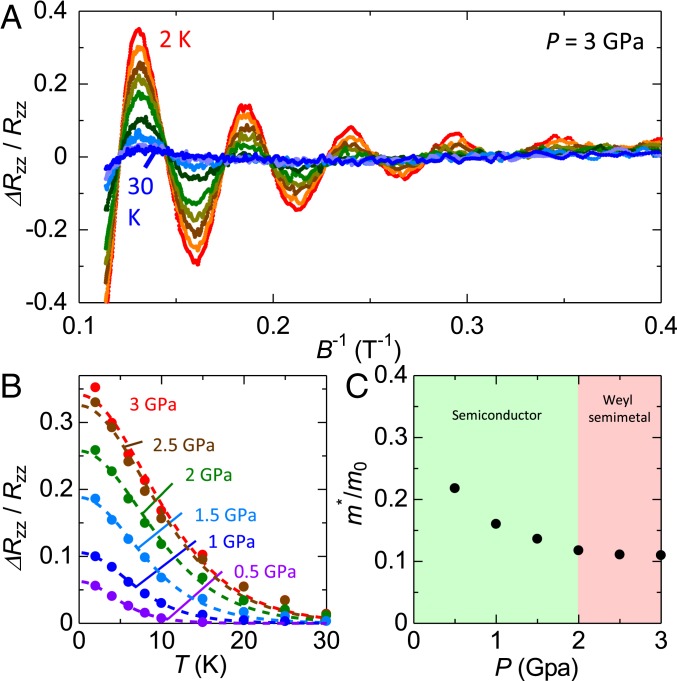
Fig. 4.
Pressure variation of the effective mass. (A) Oscillating component of sample 2 under P = 3 GPa at various temperatures. (B) Temperature dependence of amplitude of SdH oscillations under various pressures. Dashed line represents the fitting by the Lifshitz–Kosevich formula. (C) Pressure variation of the effective mass normalized by free-electron mass . decreases with pressure, showing the convergent behavior toward P = 2 Gpa.

