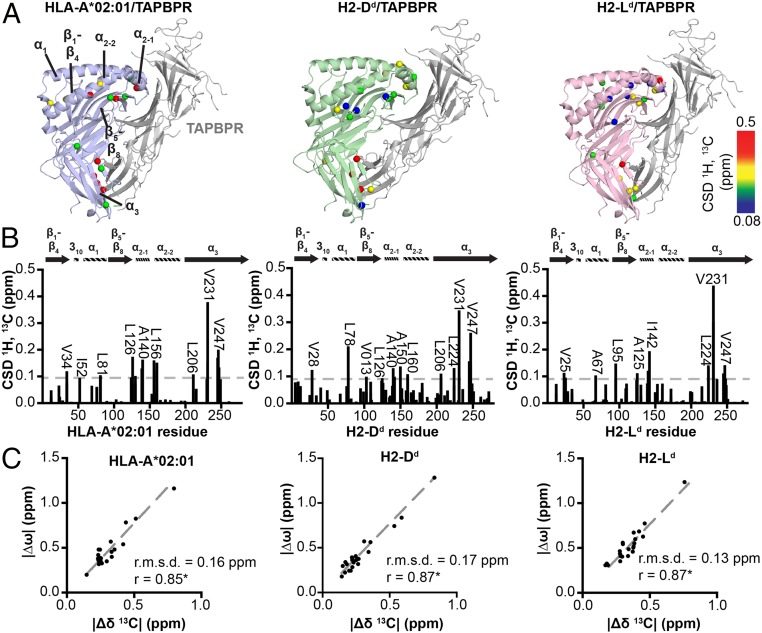
Fig. 4.
Dynamic surfaces of pMHC-I structures correlate with TAPBPR recognition sites. (A) Methyl CSDs upon chaperone binding plotted onto the structure of MHC-I/TAPBPR complexes: TAX/HLA-A*02:01/hβ2m (blue), P18-I10/H2-Dd/hβ2m (green), and NIH/H2-Ld/hβ2m (pink) with TAPBPR shown in gray. The H2-Dd/TAPBPR crystal structure was obtained from PDB ID 5WER. The other structures are Rosetta homology models using PDB ID 5WER as a template (70). Affected regions are labeled. ΔCSDs are colored based on the scale shown at right. (B) Methyl CSDs measured from NMR titration experiments upon TAPBPR binding are shown as a function of heavy-chain methyl residue number. Select methyl groups affected are noted. The gray dotted line represents the average CSD + 1 SD. (C) The absolute value of the difference in the 13C chemical shift of the major and minor states of unchaperoned pMHC-I obtained from CPMG relaxation dispersion data (|Δω|, ppm) is shown as a function of the absolute value of the difference in the 13C chemical shift between the free and TAPBPR bound pMHC-I states determined from NMR titrations (|Δδ13C|, ppm). The slope (dotted gray line), the Pearson correlation coefficient (r), and the root mean square deviation (r.m.s.d.) are given for each correlation graph. The correlations are statistically significant with a P < 0.0001. HLA-A*01:01 is not included because there is no detectable TAPBPR binding under the NMR sample conditions (see Fig. 2).

