Fig. 5.
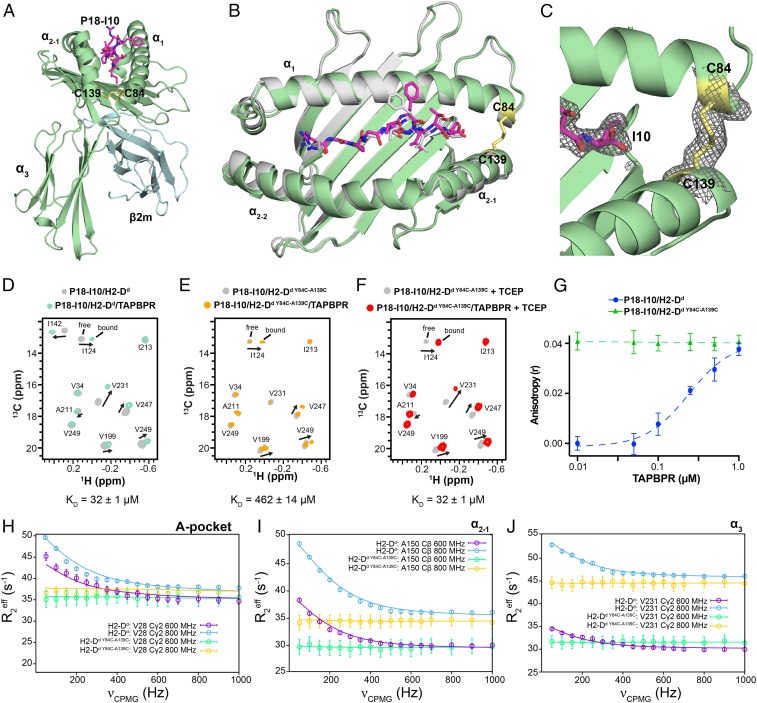
Restriction of dynamics in the pMHC-I groove abrogates binding to TAPBPR. (A) View of the P18-I10/H2-Dd Y84C-A139C/hβ2m complex solved at 2.4-Å resolution (PDB ID code 6NPR). The H2-Dd heavy chain is colored green, hβ2m cyan and P18-I10 magenta. The oxidized disulfide bond between C84 and C139 of H2-Dd is shown in yellow. (B) Overlay of the MHC-I groove (residues 1 to 180) and bound P18-I10 peptide for wild-type H2-Dd (PDB ID code 3ECB, gray) and H2-Dd Y84C-A139C (colored as in A). The α3 domain and hβ2m are omitted for clarity. Backbone r.m.s.d. over the entire pMHC-I is 1.4/1.7 Å; (backbone/all-atom). (C) View of the P18-I10/H2-Dd Y84C-A139C structure showing the 2Fo − Fc electron density map at 1.0 σ (gray mesh) around the P18-I10 peptide (magenta) and C84-C139 disulfide bond (yellow). (D–F) Representative 2D 1H-13C HMQC spectra from NMR titrations between TAPBPR and isotopically labeled (at the heavy chain) (D) wild-type P18-I10/H2-Dd/hβ2m, (E) P18-I10/H2-Dd Y84C-A139C/hβ2m, and (F) P18-I10/H2-Dd Y84C-A139C/hβ2m in the presence of 1 mM TCEP. The NMR spectra shown were performed with 3-fold molar excess TAPBPR. Dissociation constants obtained from NMR line shape fitting in TITAN are noted. (G) Fluorescence anisotropy experiments comparing exchange of TAMRA-labeled P18-I10 peptide with wild-type H2-Dd and H2-Dd Y84C-A139C as a function of TAPBPR concentration. (H–J) Comparison of representative 13C-SQ CPMG relaxation dispersion profiles for methyl groups of the heavy chain between wild-type P18-I10/H2-Dd/hβ2m (800 MHz, blue; 600 MHz, purple) and P18-I10/H2-Dd Y84C-A139C/hβ2m (800 MHz, yellow; 600 MHz, green) performed at 25 °C. Both experiments were performed in the presence of 3-fold molar excess P18-I10 peptide.

