Fig. 3.
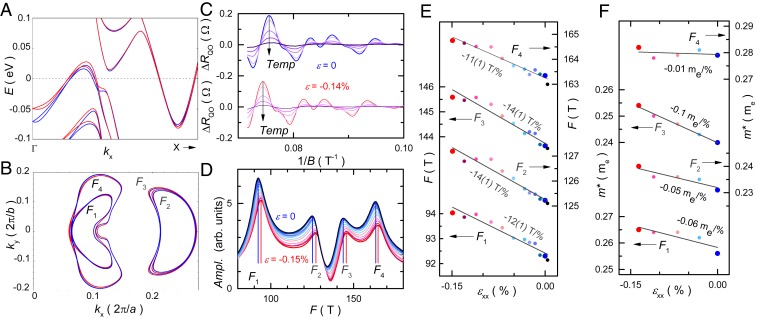
DFT results and quantum oscillation analysis under strain. (A) Results of DFT band structure calculation along the - direction without strain (; blue) and with strain (; red) applied along the axis. (B) Strain-induced modification of extremal orbits at from DFT calculation. Blue and red lines refer to the same strain as in A. FSs and correspond to hole bands and and to electron bands. (C) Experimental results for SdH oscillations after subtracting the background at temperatures 2, 3, 5, 7, and 10 K for sample S2. The upper plot is for 0, and the lower plot is for –0.14. (D) FFT results at various . Blue lines indicate the frequencies at 0 , and red lines are located at the frequencies at −0.15 strain. (E) SdH oscillation frequencies of the 4 extremal orbits as a function of strain . The numerical values of the slopes are given in the figure. (F) Effective cyclotron masses of the 4 extremal orbits as a function of strain, with slopes given in the figure.

