Fig. 1.
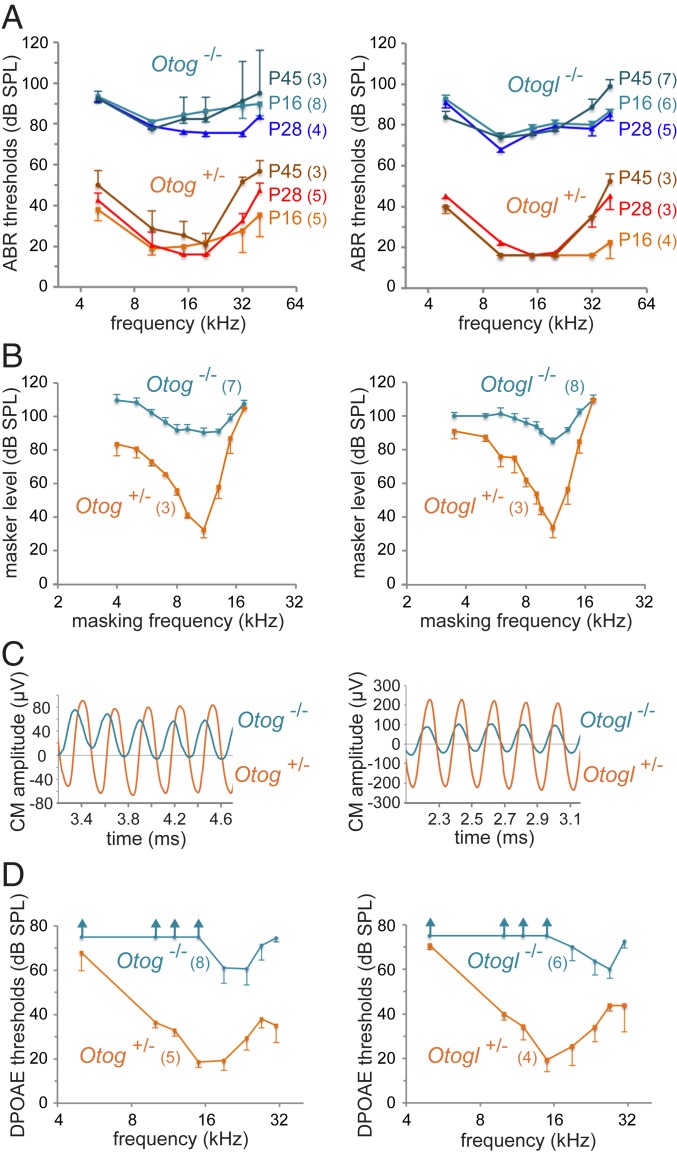
Auditory tests in Otog−/− and Otogl−/− mice. Results for Otog−/− (diagrams on the left) and Otogl−/− (diagrams on the right) mutant mice and for aged-matched Otog+/− and Otogl+/− controls are presented in blue and in red/brown, respectively (different shades of blue and red/brown for different ages). The numbers of animals studied for each genotype are indicated in brackets. (A) ABR thresholds (mean ± SD) in response to short tone pips at different frequencies (horizontal axis) and at different ages. (B) Masking tuning curves in P28 mice (mean ± SD) showing the intensity level against frequency of a continuous tone (masker) required for a 50% decrease in amplitude of the CAP produced by a 10-kHz tone pip (test tone) presented at 10 dB above the ABR threshold. (C) Steady-state CM potential recorded in P16 mice with an electrode located at the round window, and produced by a long 5-kHz tone pip at 95 dB SPL. Note the asymmetry and phase shifts of the waveforms in the mutant mice relative to the control mice. (D) DPOAE thresholds (mean ± SD) for 2-tone stimuli (frequencies f1 and f2, at equal intensities) across the f2 frequency in P16 mice. Vertical arrows indicate the absence of DPOAE for the maximal intensity of the stimulus (75 dB SPL).

