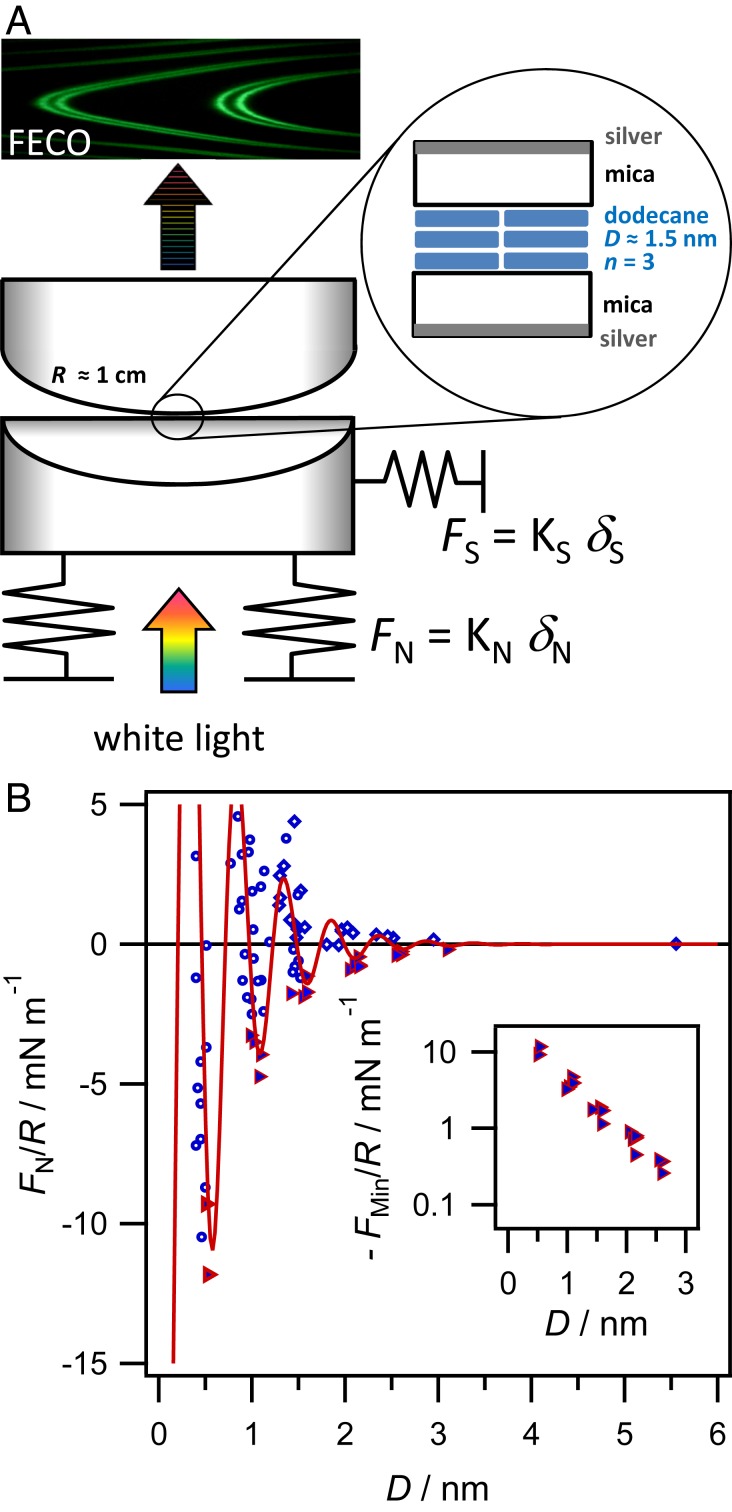
Fig. 1.
(A) Schematic diagram of the SFB setup, showing the path of light through the optical lenses arranged in crossed-cylinder orientation. A photograph of a typical interference spectrum (FECO), used to determine and precise contact geometry, is shown at top. A zoom-in to the contact area shows detail of the interferometric cavity with liquid confined to nanofilms, thickness D, between two atomically smooth mica sheets. (B) Measured normal force, normalized by the radius of curvature, between two mica sheets arranged in crossed-cylinder configuration across a dodecane film as a function of dodecane film thickness. Diamonds show data measured on approach of the surfaces, circles show data measured on retraction, and adhesive minima are marked as filled triangles. The solid line fits the measured force to , with 0.49 nm, and 0.51 nm (further discussion in SI Appendix). Inset shows the magnitude of the adhesive minima on a log-linear scale. Data in this figure correspond to mica sheets in crystallographic alignment (); a comparison with is provided in SI Appendix.

