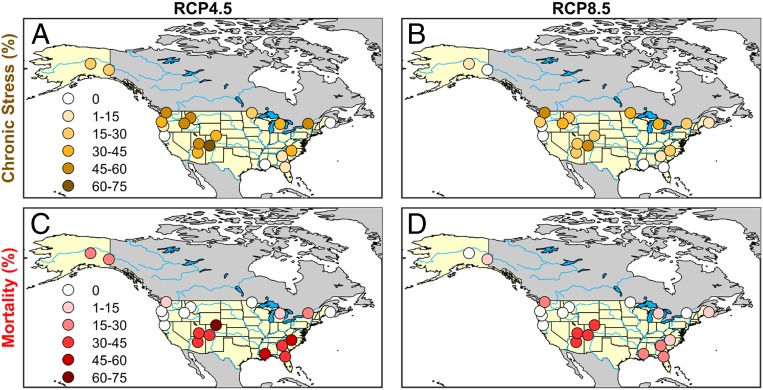
Fig. 4.
Regional distribution of chronic hydraulic stress and mortality for nonacclimated stands. Chronic hydraulic stress (orange-toned circles) indicated as the percentage of simulations per site (n = 12, 6 climate models and 2 species per location) exceeding the chronic stress threshold in average percentage loss of hydraulic conductance (Fig. 2, mean PLCmax = 10) over a 30-y period. Mortality (red-toned circles) is indicated as percent of simulations per site exceeding the hydraulic mortality threshold in any year (Fig. 2, max PLCmax > 85). Darker symbols represent higher levels of stress as labeled. (A) Chronic stress for RCP4.5 CO2 concentration. (B) Chronic stress for RCP8.5. (C) Mortality for RCP4.5. (D) Mortality for RCP8.5.

