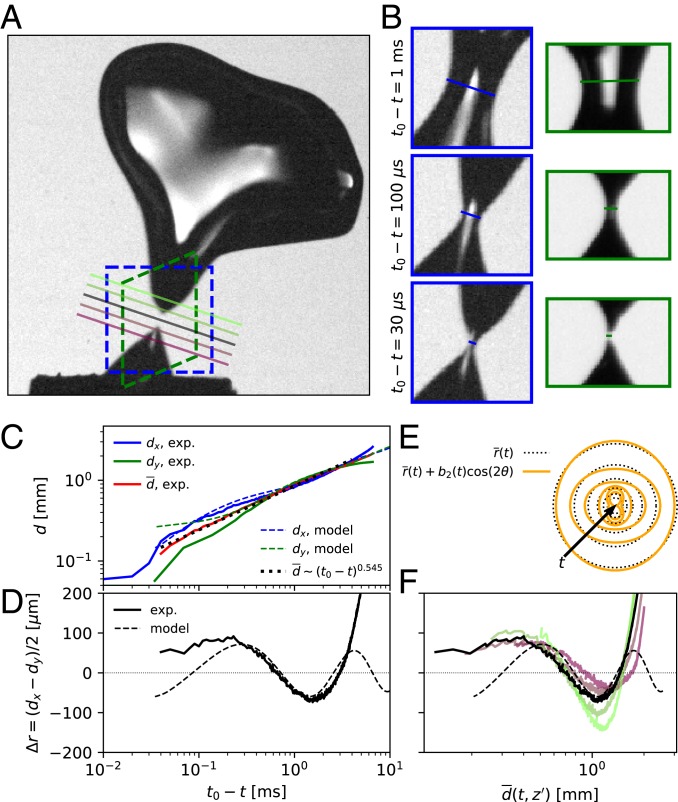
Fig. 2.
Reconstruction of the bubble pinch-off in a turbulent flow from 2 views, with and . (A) Large-scale view of the bubble in the first frame after pinch-off, where the green and blue dashed regions indicate the 2 fields of view (separated by a angle) in the and planes. Colored lines indicate various vertical planes used for the vertical analysis of the neck. (B) Close-up views at various times showing that the thinnest neck position does not move vertically and that both views exhibit necks of different sizes. Movie S1 shows the collapse. (C) Neck diameters and in the 2 views during the pinch-off. The 2 do not superpose, hence breaking the circular invariance. While the individual time evolution of and does not exhibit self-similar pinch-off, the mean diameter (red) follows a self-similar scaling, , with fitted to the data (black dotted line), which are very close to the values observed for bubble pinch-off in still water and predicted theoretically. (D) Difference as a function of time . The oscillating behavior can be described up to ms by the dynamics of an elliptical perturbation indicated in dashed lines [reconstructed using Eq. 1, with and mm/s]; this is also shown in colored dashed lines in C. (E) Snapshots of the neck shape reconstructed with Eq. 1 (orange; solid lines) and the mean circular shape (black; dotted lines) during the collapse. (F) Difference as a function of the mean neck diameter for the different vertical neck planes , with the colors corresponding to the slices shown with the similarly colored line in A. When plotted against the local average neck size, different slices of the neck evolve in phase with each other and exhibit similar oscillatory behavior, showing that no vertical dynamics take place.

