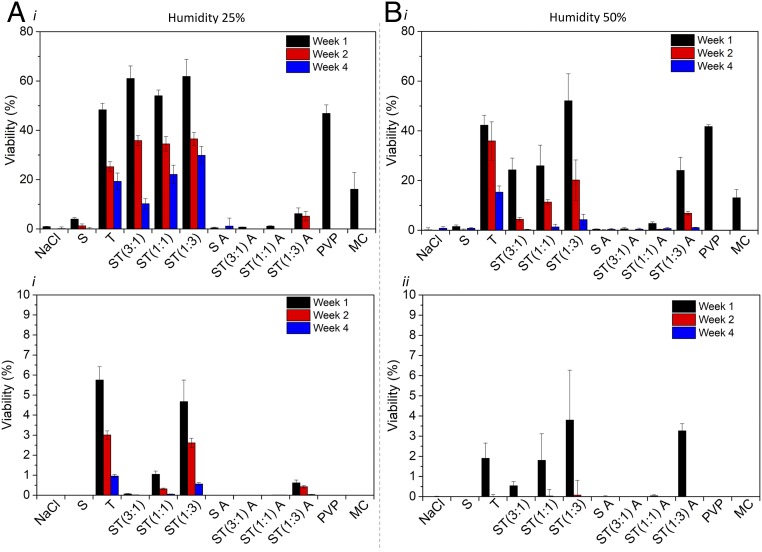
Fig. 3.
Preservation of CIAT 899 in silk, trehalose, and their mixtures. Data were collected at weeks 1, 2, and 4 for samples stored at 23 °C and at (A) 25% (B) 50% RH. In the Top, viability indicates the percentage of bacteria that were metabolically active and had intact membranes as investigated by alamarBlue analysis. In the Bottom, viability was measured as the percentage of bacteria that were culturable into colonies (colony counting analysis). Data are a pooled average ±SD of n = 5 replicates across 10 samples, and a single factor Anova test was used. Silk (S), trehalose (T), ST, x:x indicates the relative weight ratio between the 2 biopolymers, annealed 6 h (A), methyl cellulose (MC), and polyvinylpyrrolidone (PVP).

