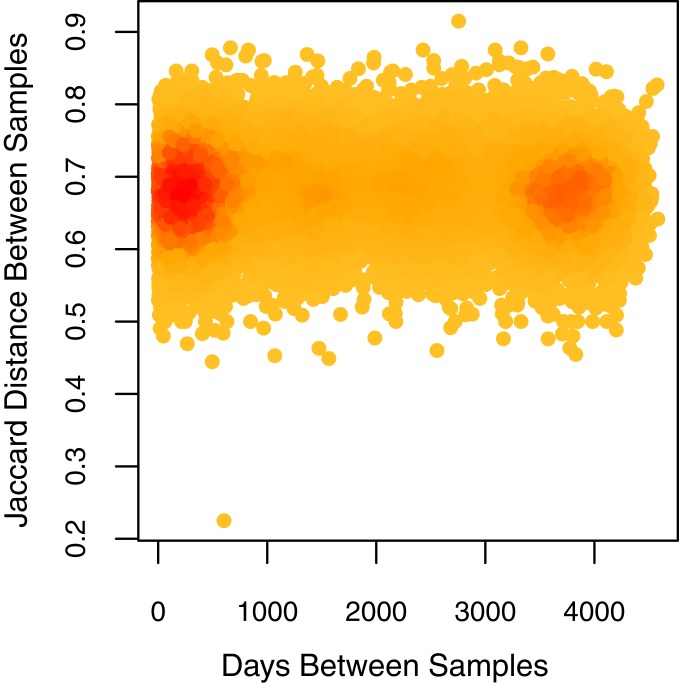
Fig. 1.
Fungal aerobiota at MLO over time. Density plot of pairwise Jaccard distance between fungal aerobiota from each sample by days. The darker the color, the more samples fall in that region. The difference between fungal composition remained constant independent of proximity of sampling periods.

