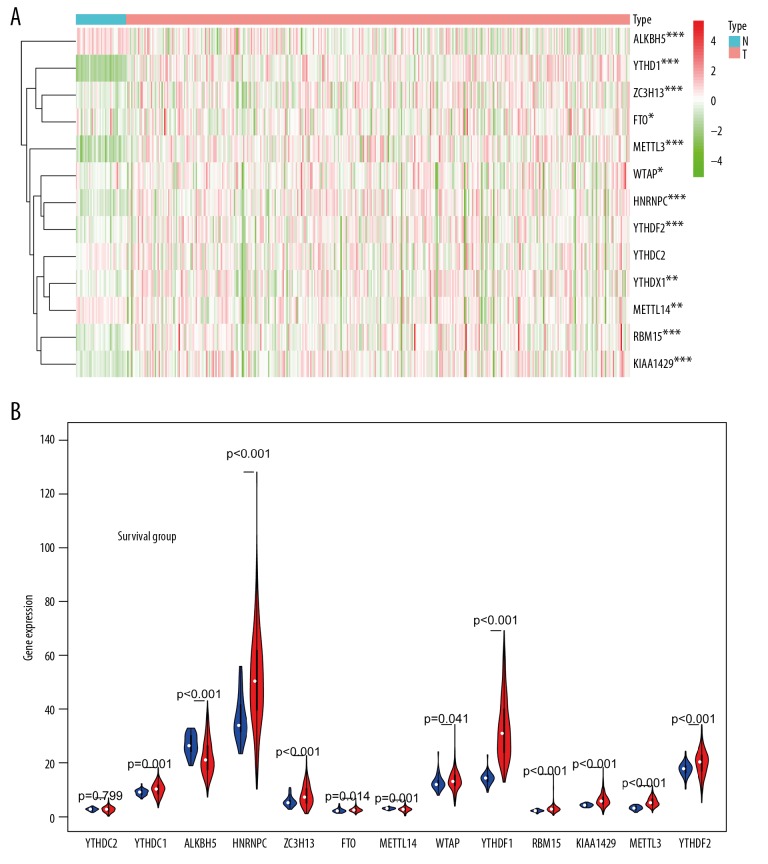
Figure 1.
Expression of m6A RNA methylation regulators in colon adenocarcinoma. (A) Heatmap of the expression of 13 m6A RNA methylated regulatory factors in different colon adenocarcinoma. The depth of red represents the level of high expression, and the depth of green represents the level of low expression * P<0.05, <0.01, <0.001, <0.0001. (B) The violin diagram showed the median expression of 13 m6A RNA methylated regulatory factors in colon adenocarcinoma, and position of white spots on the way represented the median value of expression. * P<0.05, <0.01, <0.001, <0.0001.

