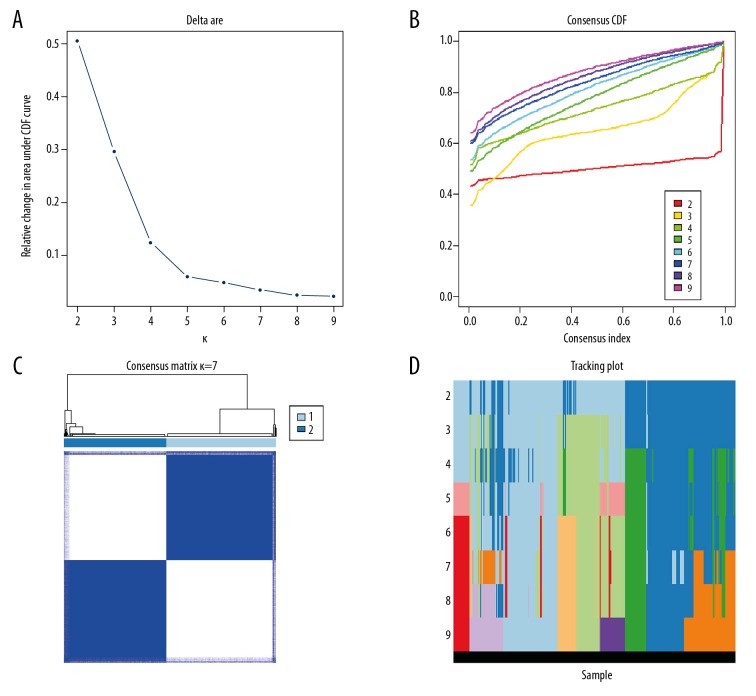
Figure 2.
Consistent cluster analysis of colon adenocarcinoma. (A) The consistency clustering cumulative distribution function (CDF) when k is between 2 and 10. (B) The relative change of the area under the CDF curve from 2 to 10 of k. (C) At k=2, the correlation between groups. (D) The distribution of the sample when k is between 2 and 10.

