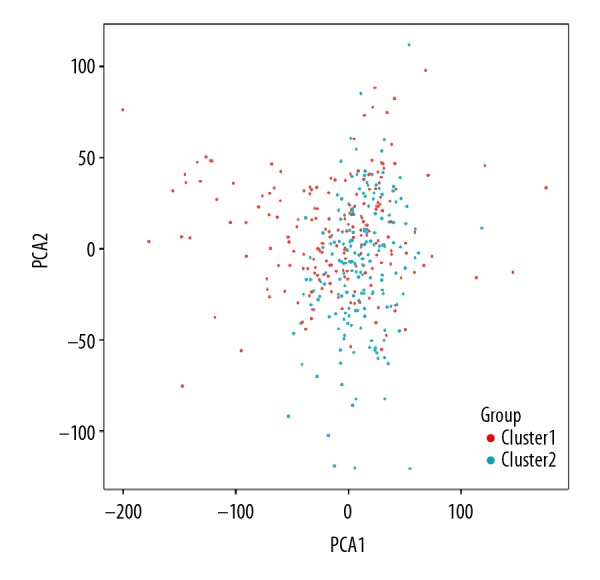
Figure 3.

Principal component analysis of 2 clusters of total RNA expression profile after consistency analysis of colon adenocarcinoma in TCGA dataset. The Cluster I subgroup is marked in red and Cluster II subgroup in cyan. The scattered points show the distribution of RNA expression in the 2 subgroups.
